This post is a follow up from our July 21st post – Sugar Technical Analysis
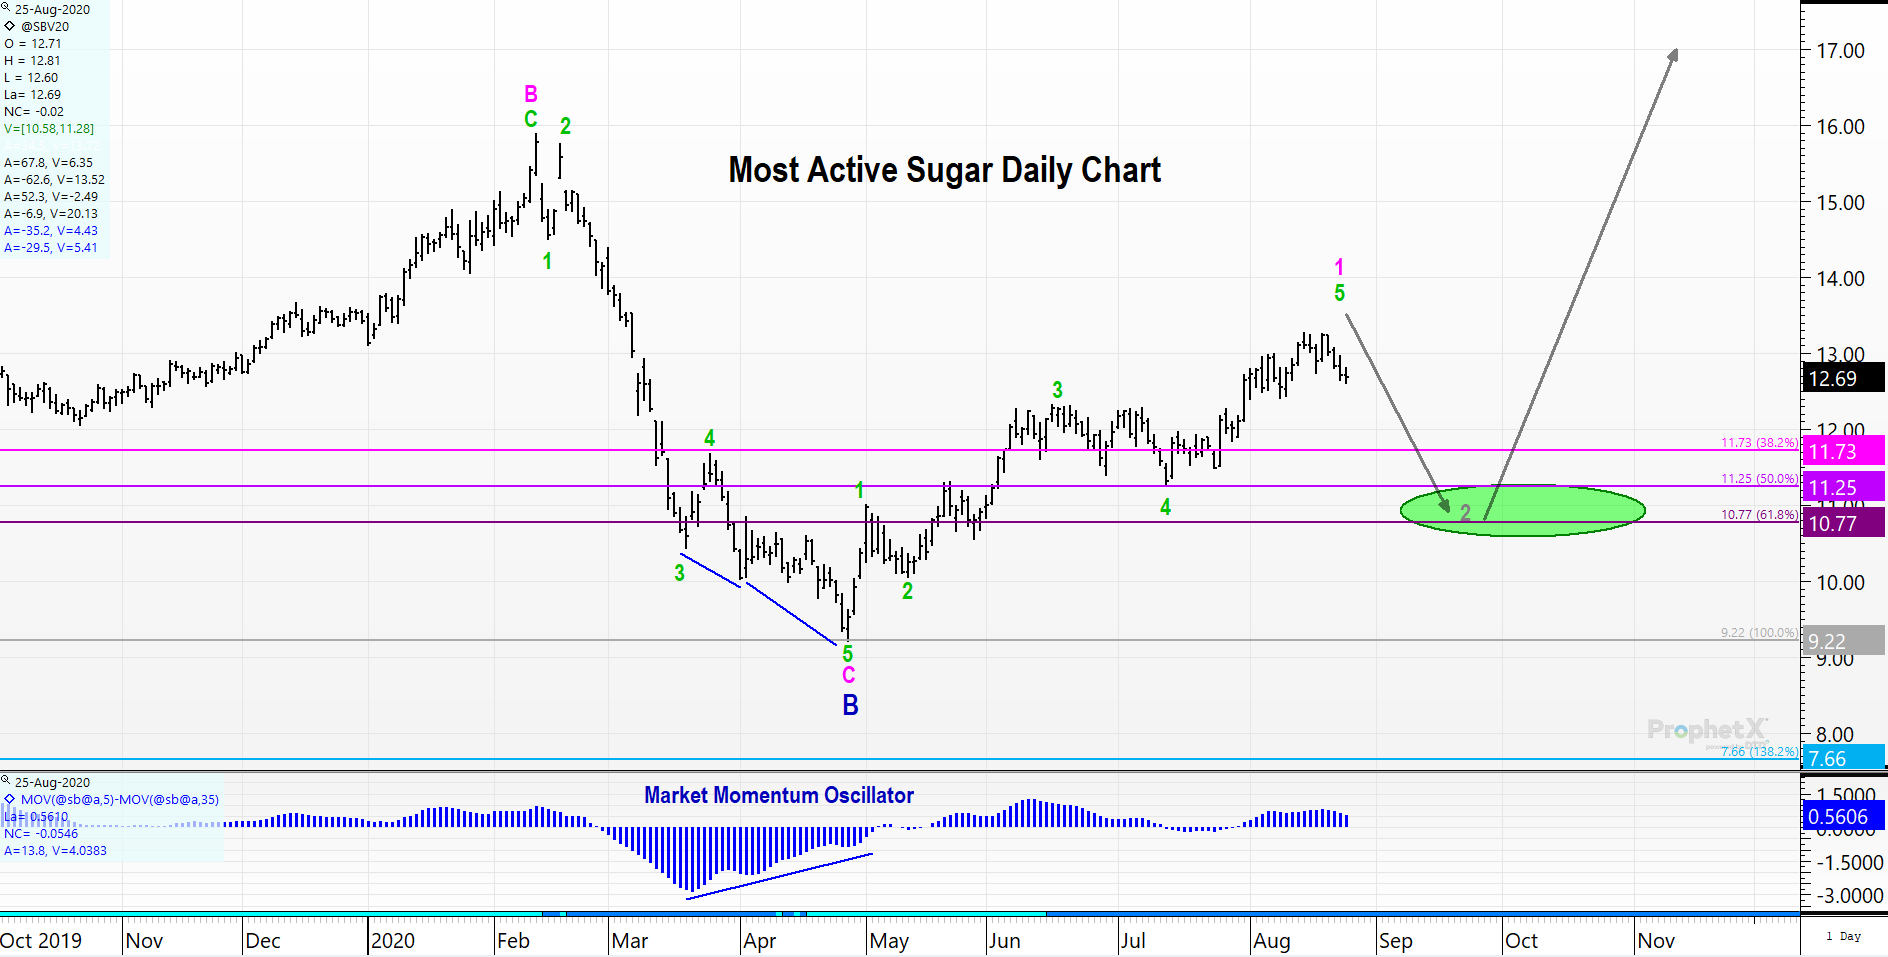
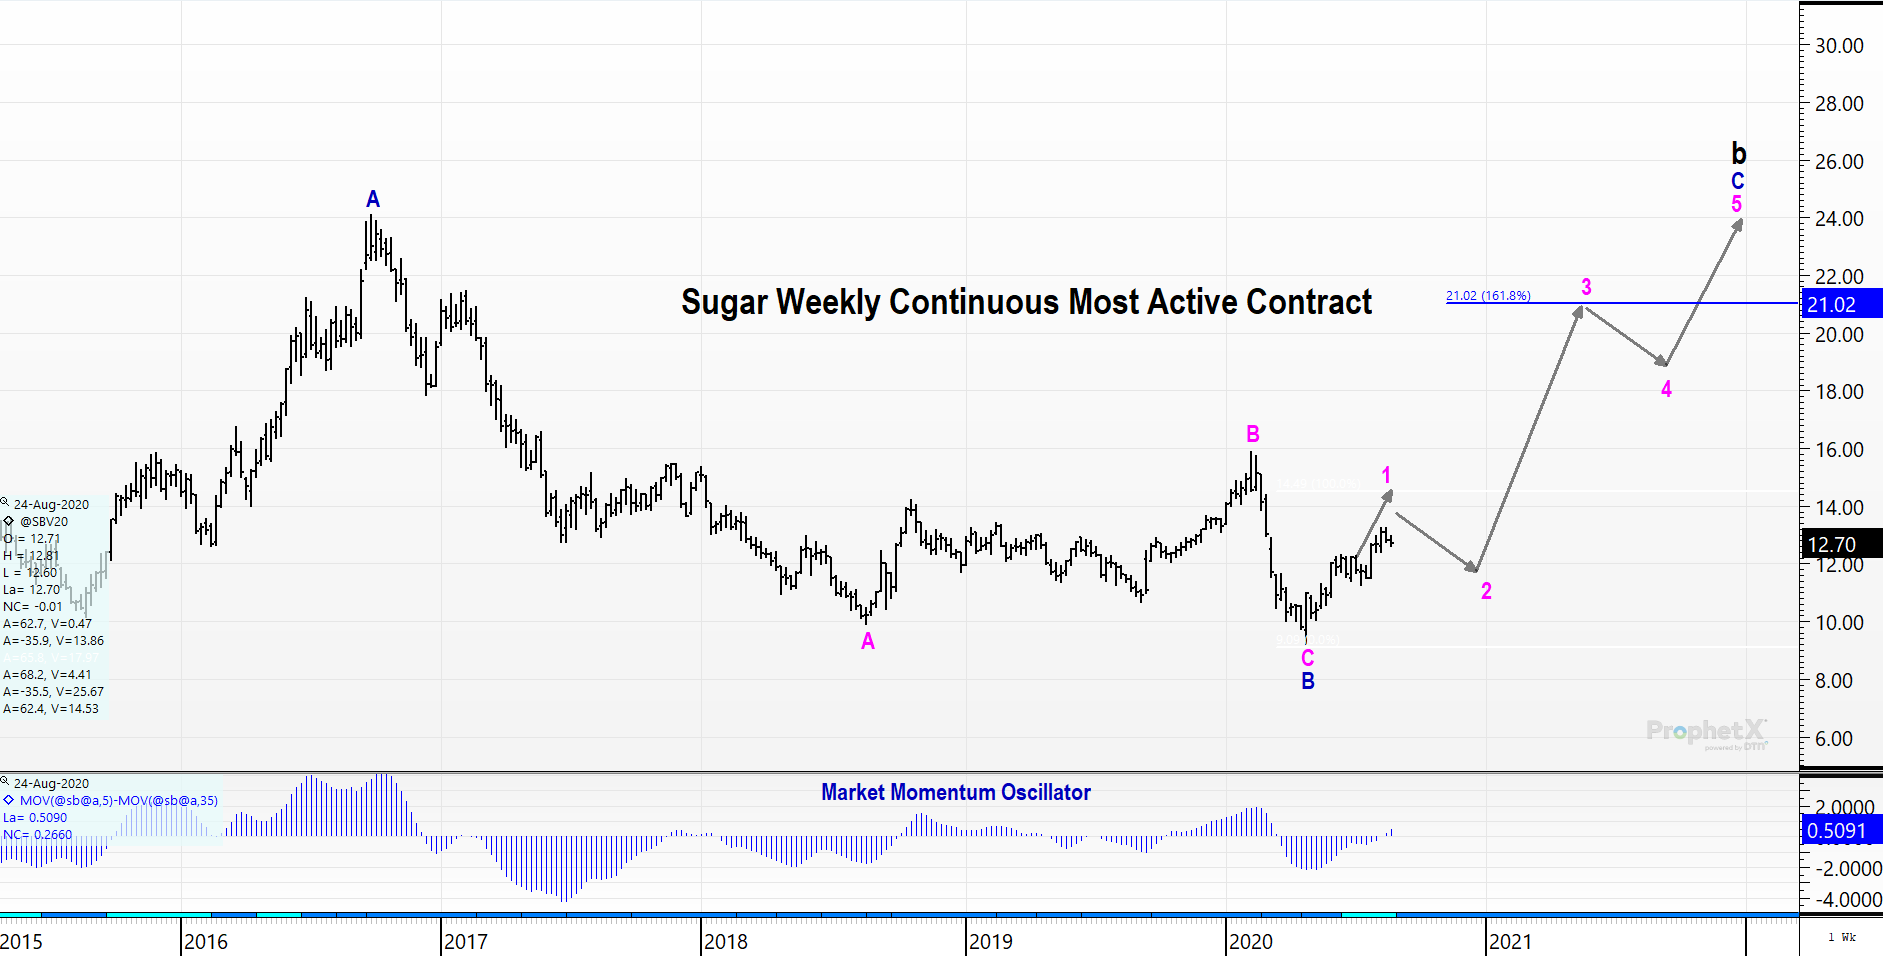
At present, all minimal requirements for a completion of wave 1 are met. Below is a chart of the most active (October) contract daily chart. Our primary (most favored) wave count is displayed in the chart below.
Expectations are that the next major move will be to the downside in the 10.80-11.30 range to complete wave 2. This will provide an excellent buying opportunity as we feel the long-term trend has turned higher.
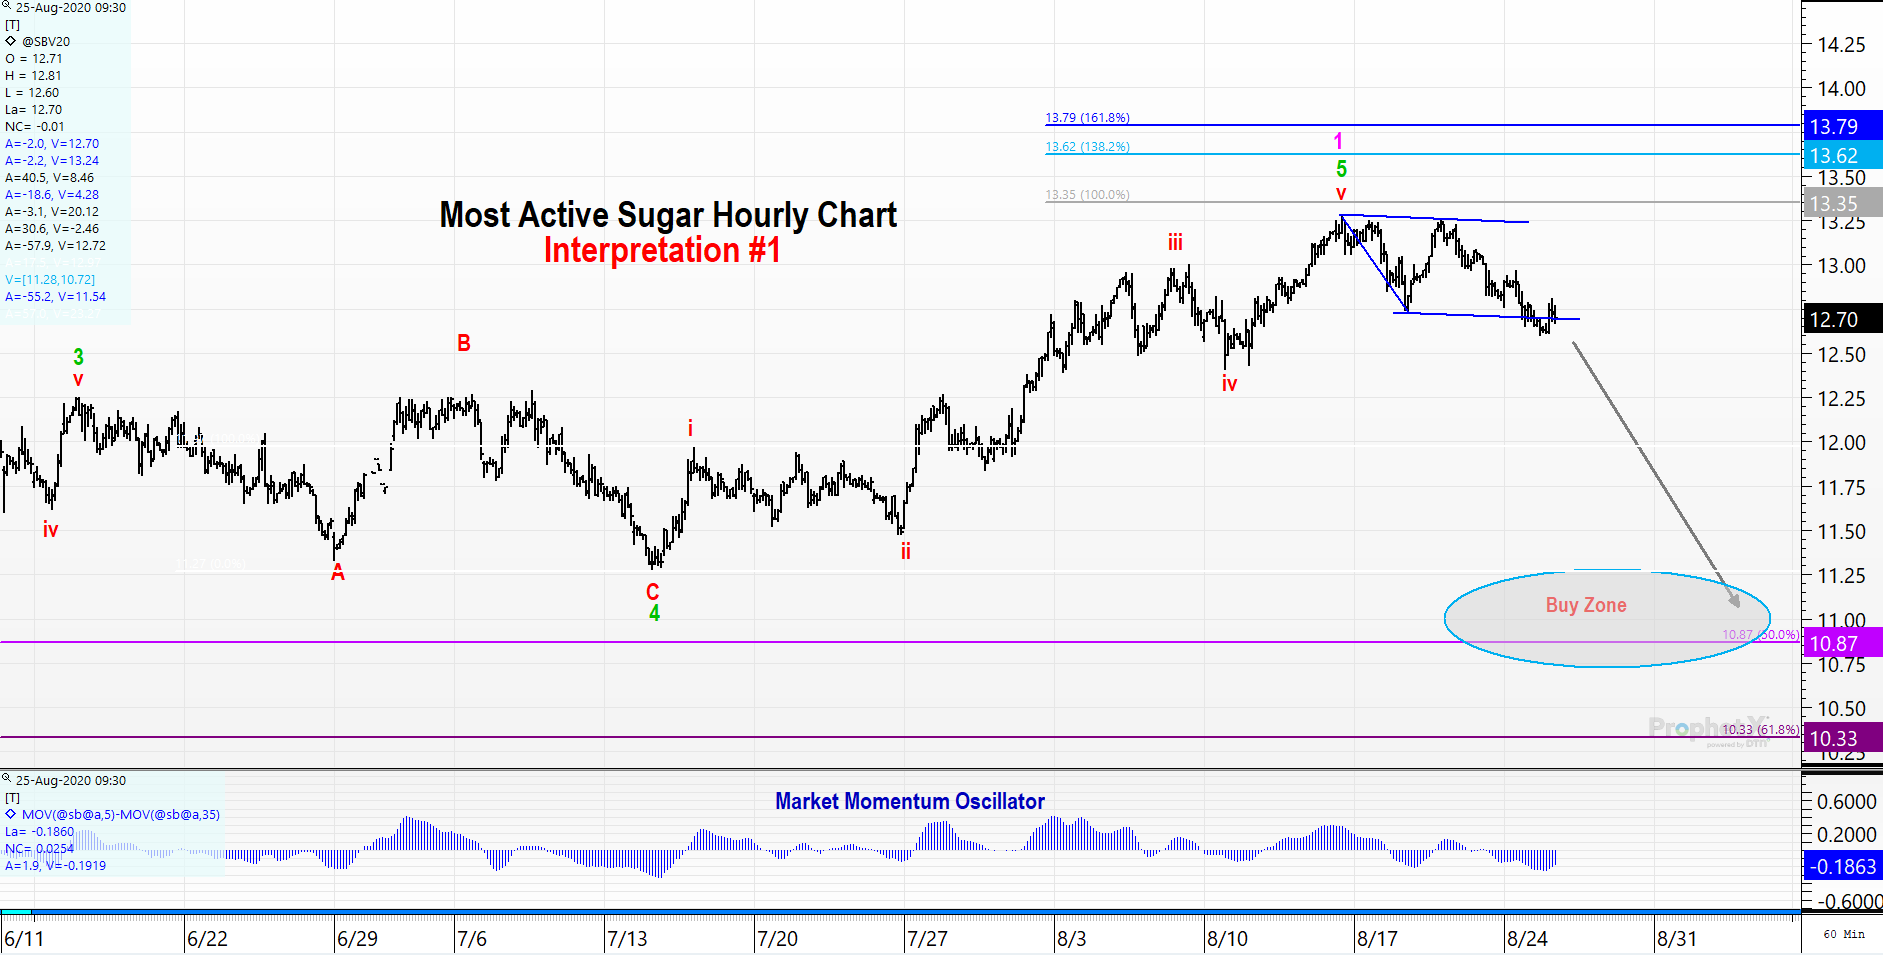
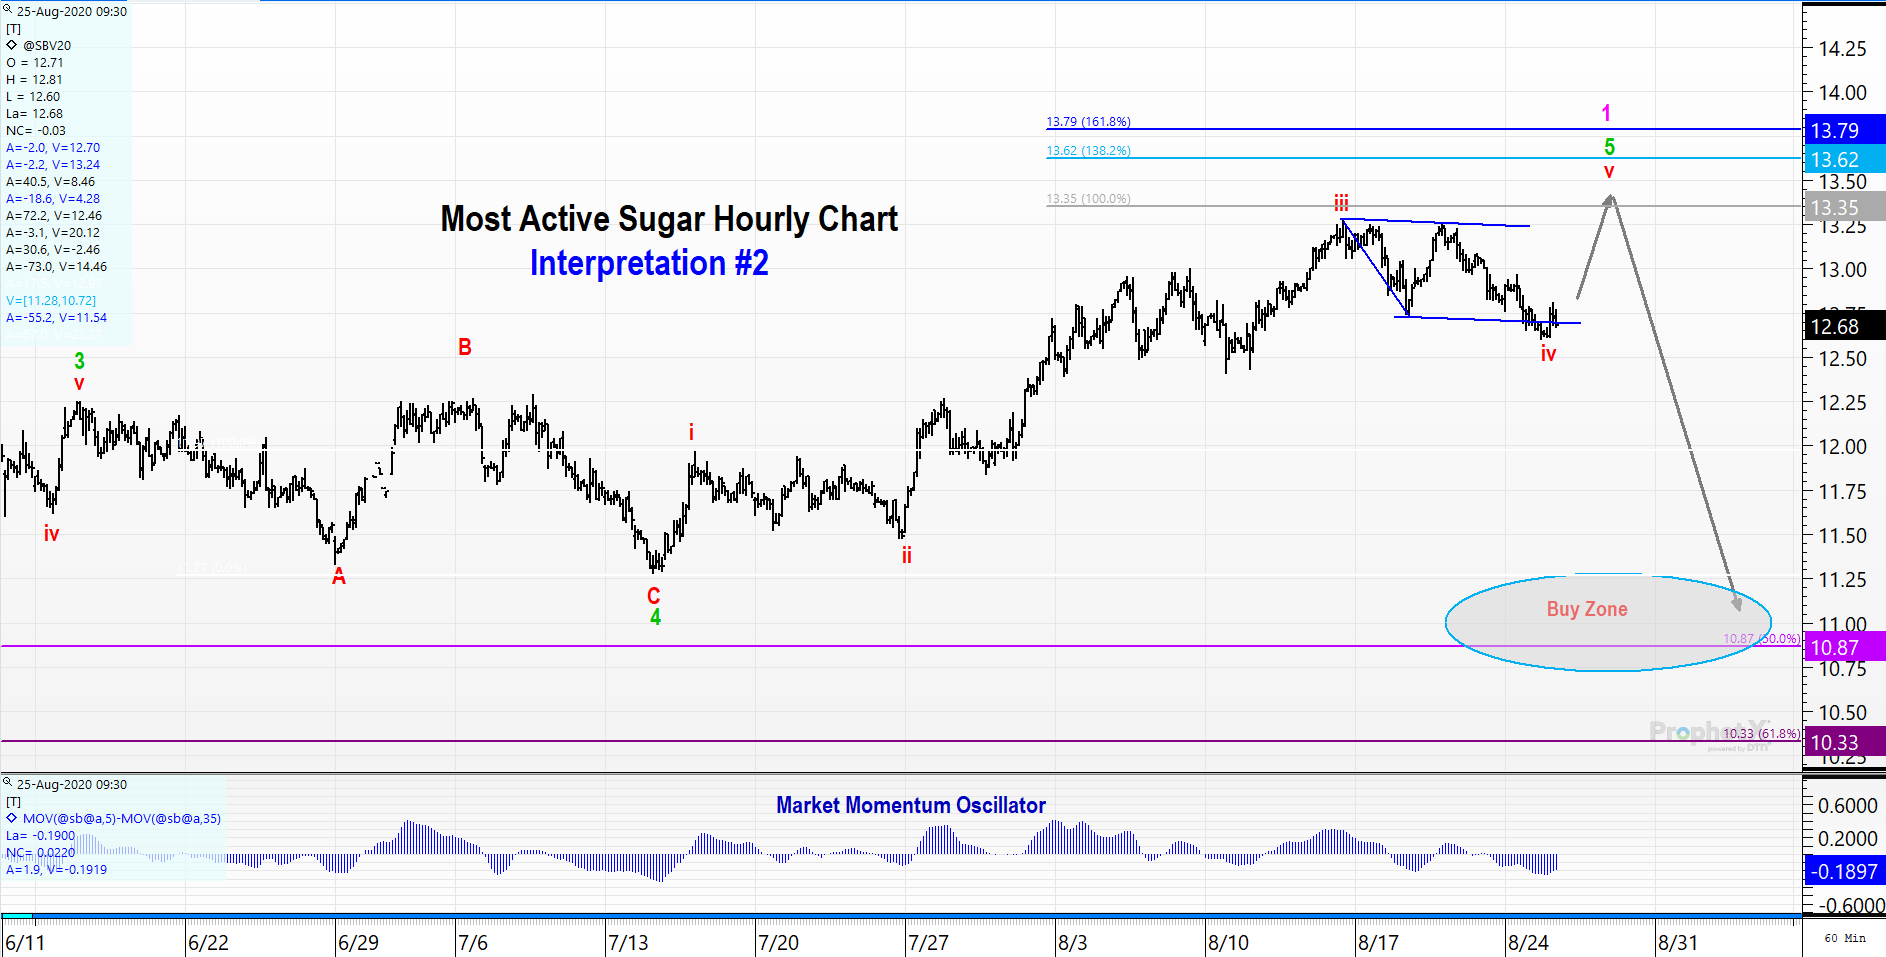
That being said, there is an alternative wave interpretation that suggests we see one more new high (minor move) before wave 1 is complete. Both primary and alternative wave counts can be seen on the hourly charts below.
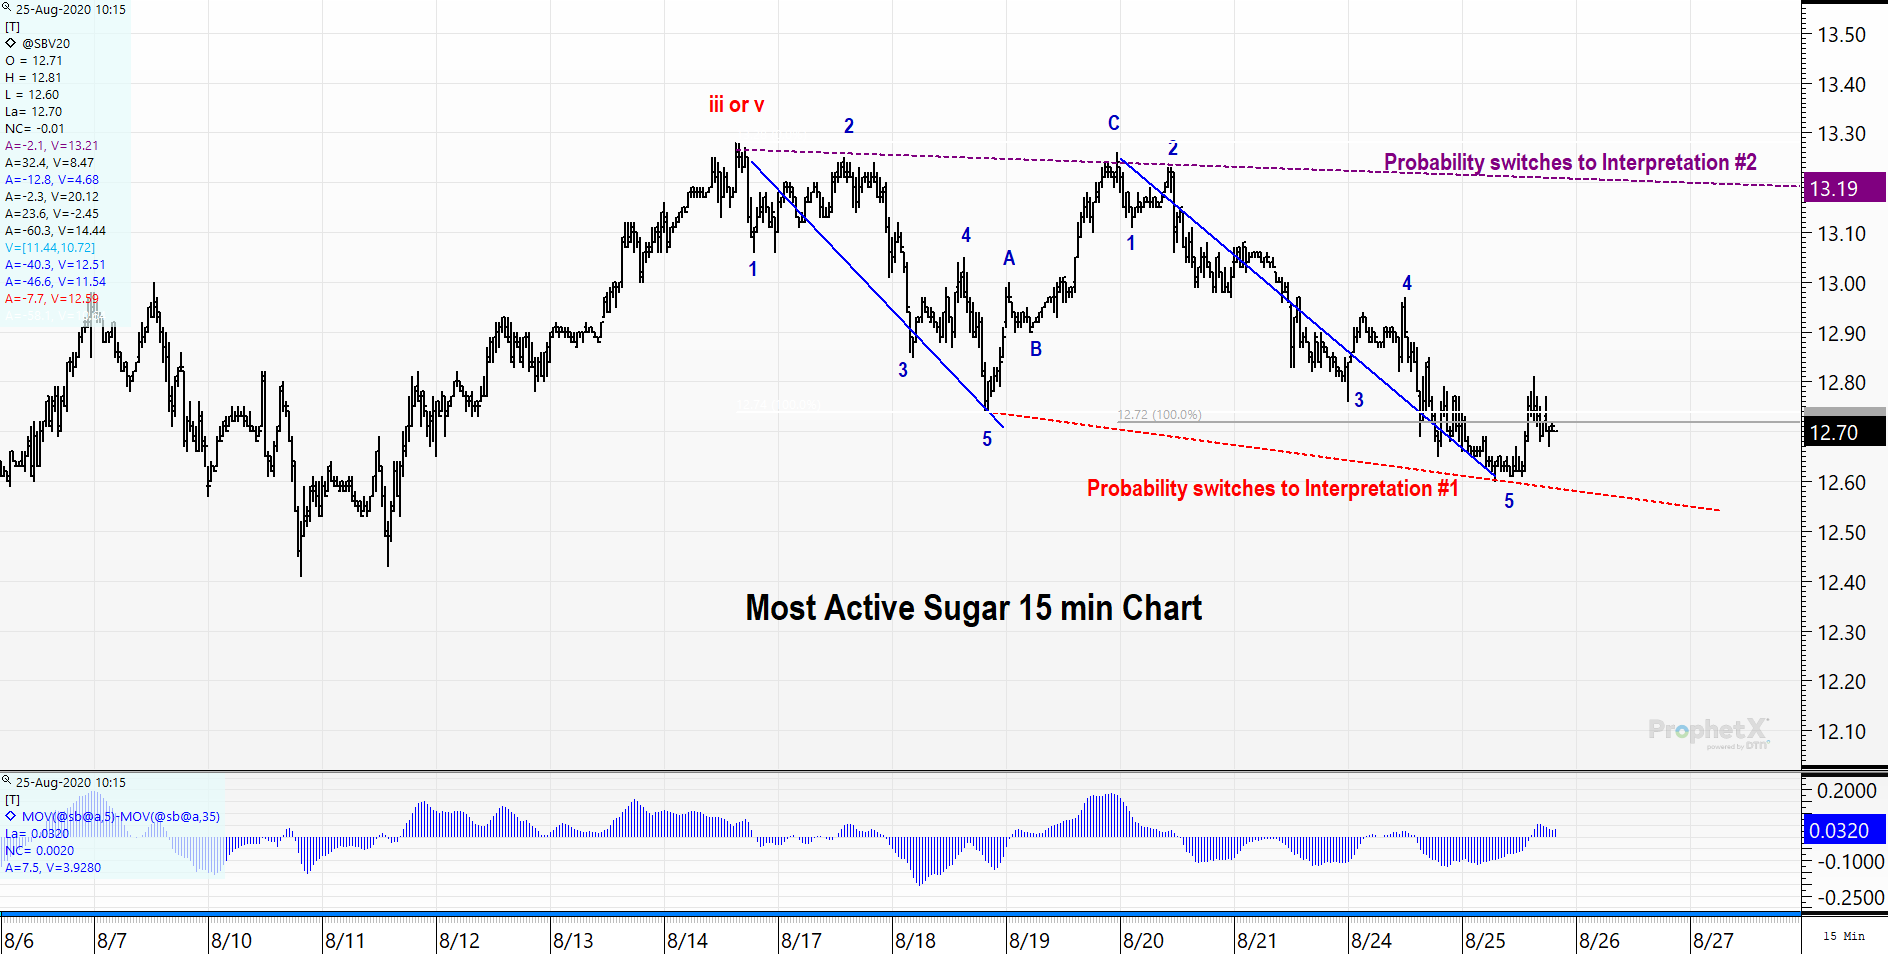
Zooming in on a 15-minute chart, we can look for clues as to which hourly interpretation will come to fruition. If prices settle below the red, dotted line, probability shifts favorably to interpretation #1. Conversely, if prices settle above the purple, dotted line, probability shifts to interpretation #2.
In fact, the more time we spend above the red dotted line and do not accelerate below (as expected), the more likely interpretation #2 becomes each day.
Regardless of how the short-term wave interpretations play out, the next major move (10%) should be to the downside. Since the longer-term trend turned higher back in June, this pullback should provide an excellent opportunity to purchase and extend coverage.
Taking a look at some traditional technical indicators
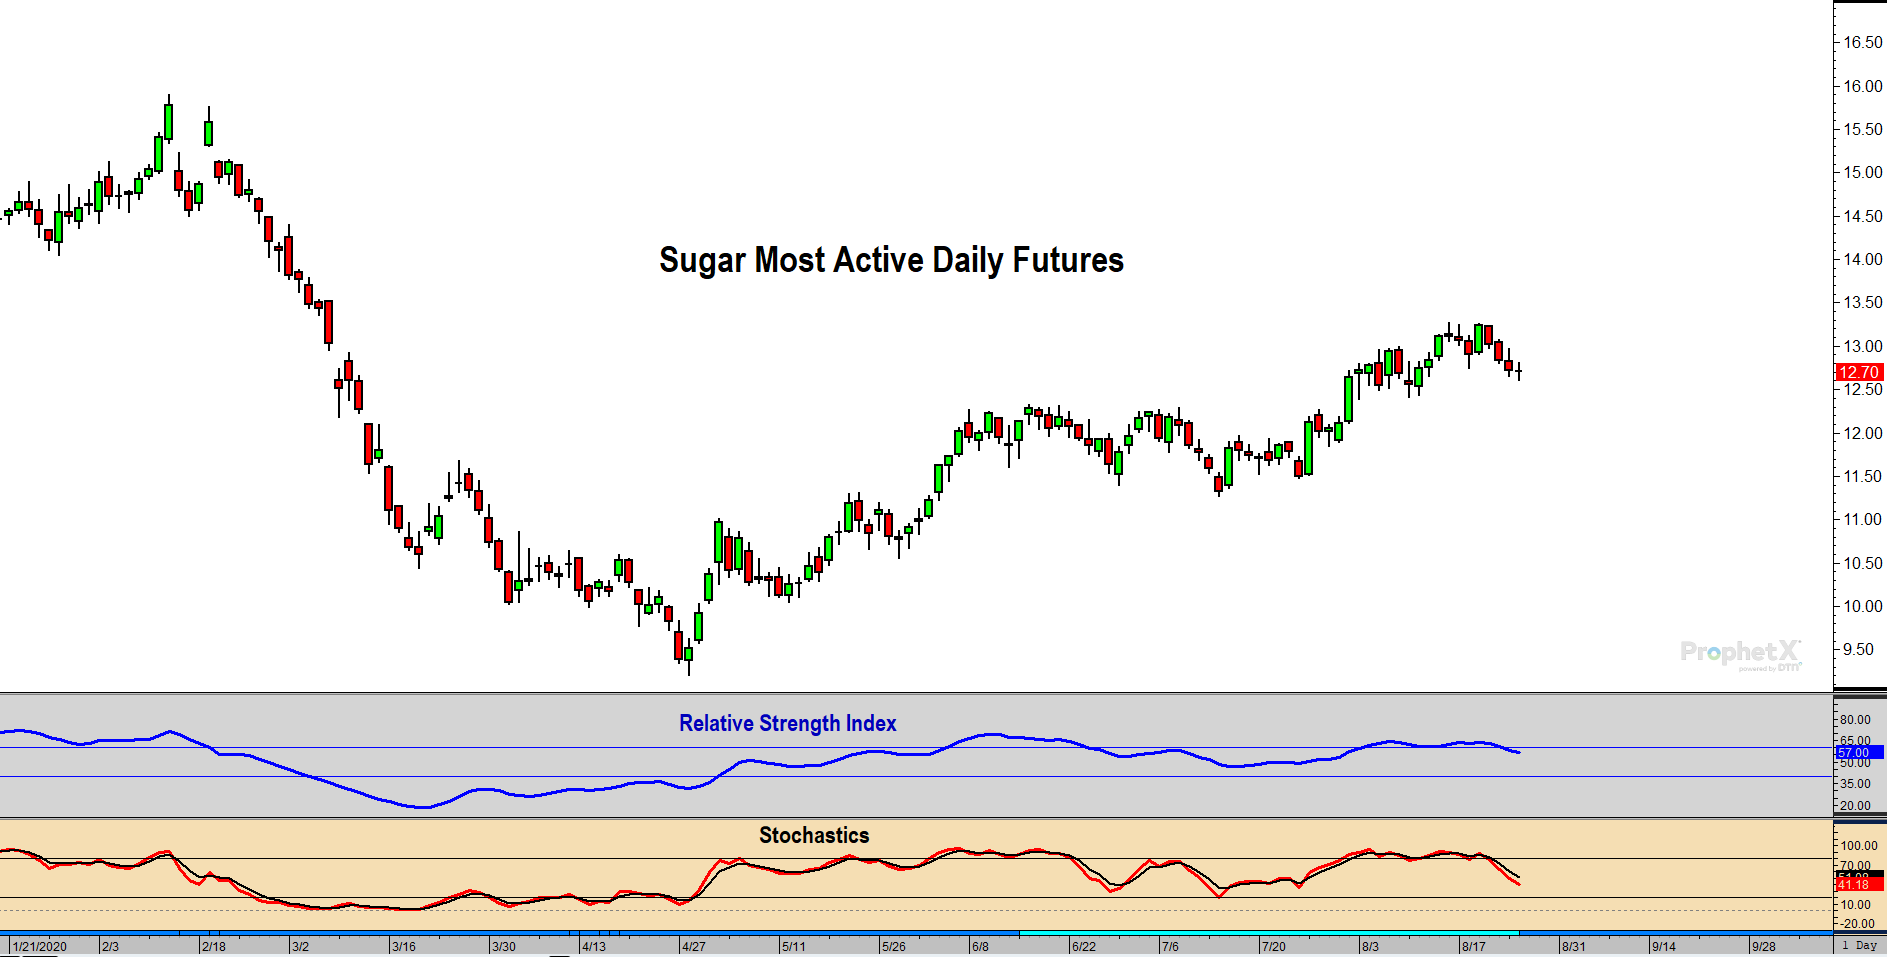
The RSI and Stochastics favor interpretation #1 because of the following:
- Stochastics showed divergence in overbought territory and have since turned lower.
- RSI conquered the 60 level the past few months. This suggests the longer-term trend is higher.
- Look for the 40 level to provide support on the previously forecast trend move lower.
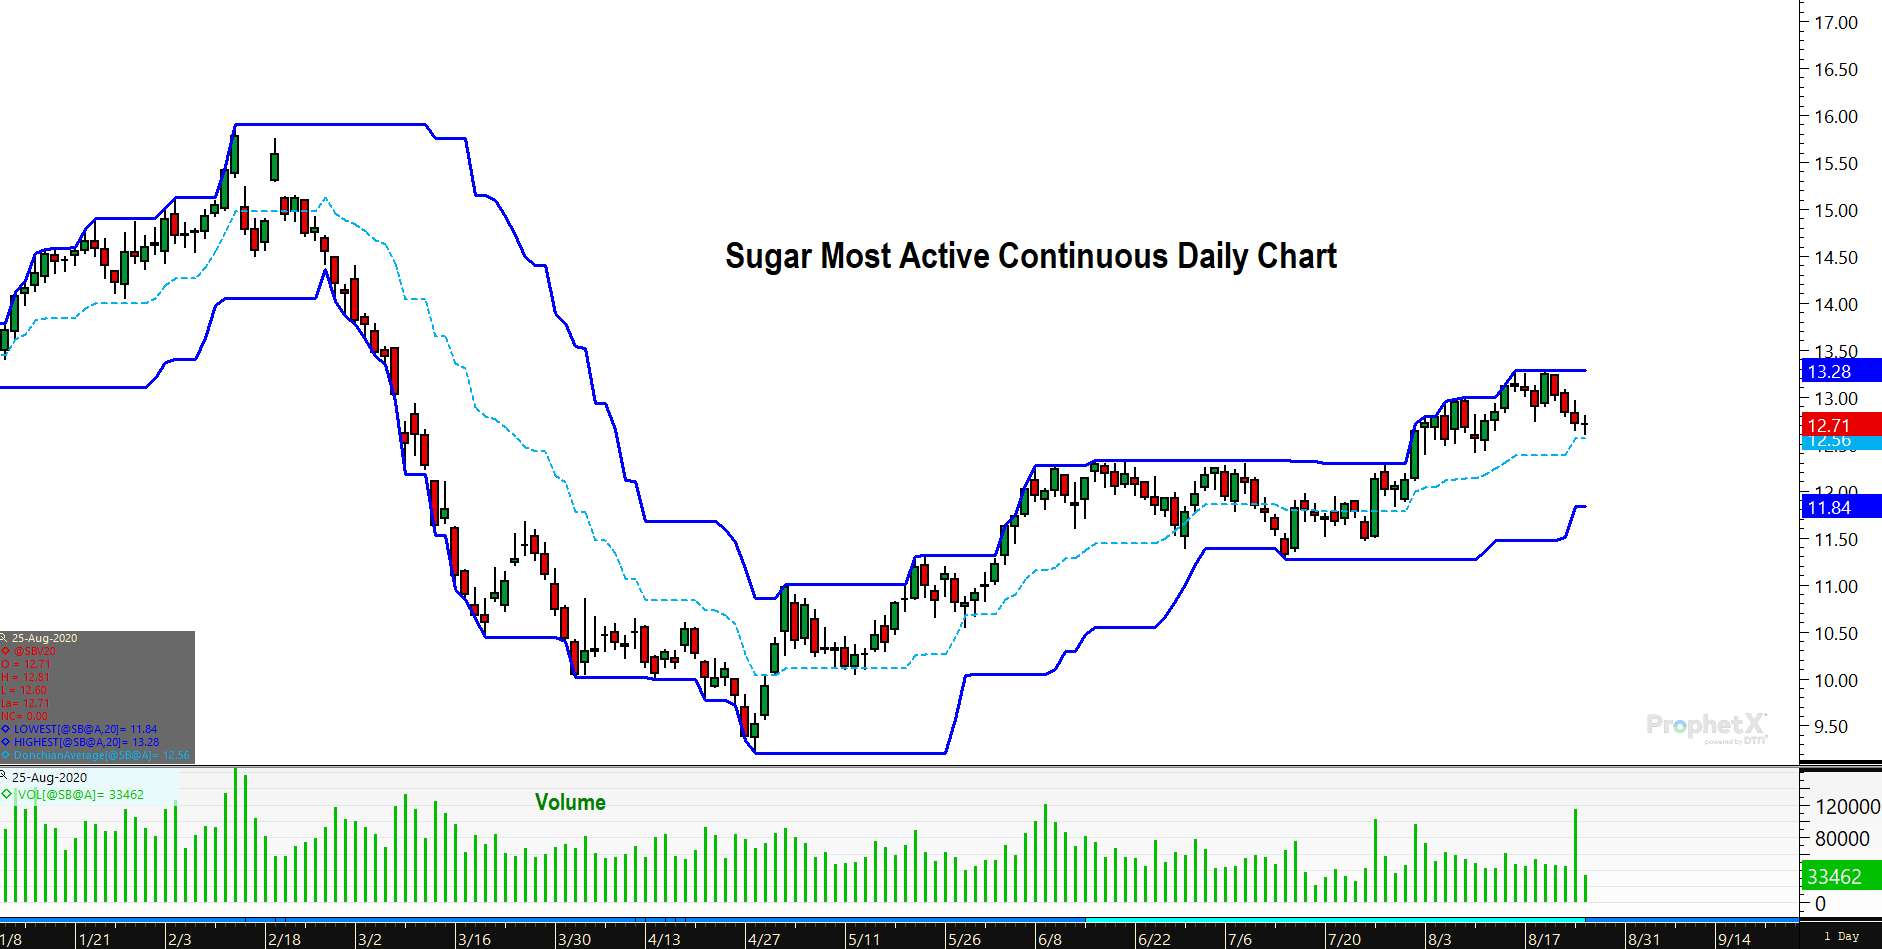
Looking at the Donchian Channel, you can see prices are still in the upper half. That suggests the trend is up and favors interpretation #2. IF prices get below the midpoint of the Channel, interpretation #1 becomes more probable.
Bottom line for Sugar Buyers
Regardless of which interpretation plays out to be correct, the next major move should be lower. This will provide an excellent opportunity to add coverage as the overall trend turned higher in June.
If your current position is, “shorter than you would like”, it is advised that you cover some now. You do not have the luxury of waiting.
Markets are dynamic and volatile. They do not wait for buyers once a trend is established.
Once sufficient coverage is added, you can be patient with the strong hand to wait for the wave 2 pullback. Then you will be able to add a significant amount of coverage at a low-risk, high-probability area for reversal.
