This post is a follow up from August 5th, Wheat Futures – Time to Extend Coverage.
Since the last post, Chicago Wheat has abided by our Elliott Wave based forecast with near precision.
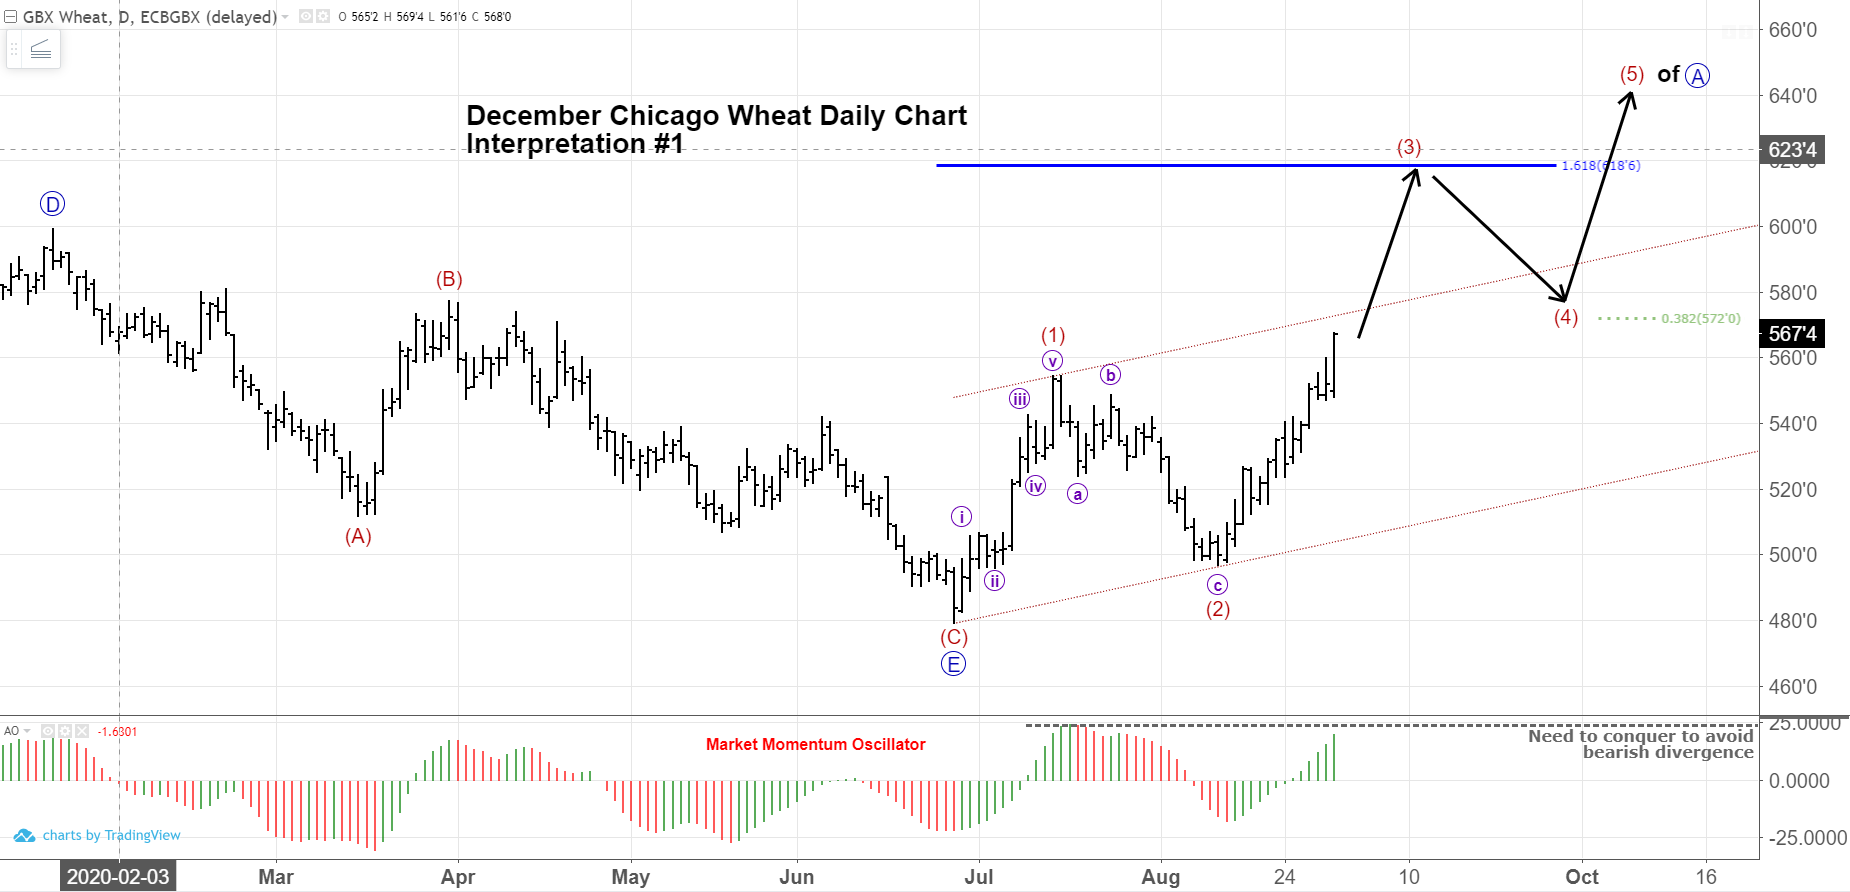
Extrapolating that forecast for the present, we expect prices to continue to zig-zag higher where December futures target $6.18/bu in wave (3) of A, pullback to the $5.80-area in wave (4), and make a final push higher in wave (5) of A to a target of $6.40. This is displayed on the daily chart below.
It should be noted that this would complete only wave A of an A-B-C sequence. Thus, as we travel through 2021, we would expect prices to retrace in wave B and make new highs in a wave C.
Translation? Long-term trend is up, and pullbacks lower in price should be deemed buying opportunities.
That being said, any buyer, trader, or analyst worth their salt always asks the questions, “Where can I be wrong?”. Or, “What signs are there that prove/disprove my market perspective?”.
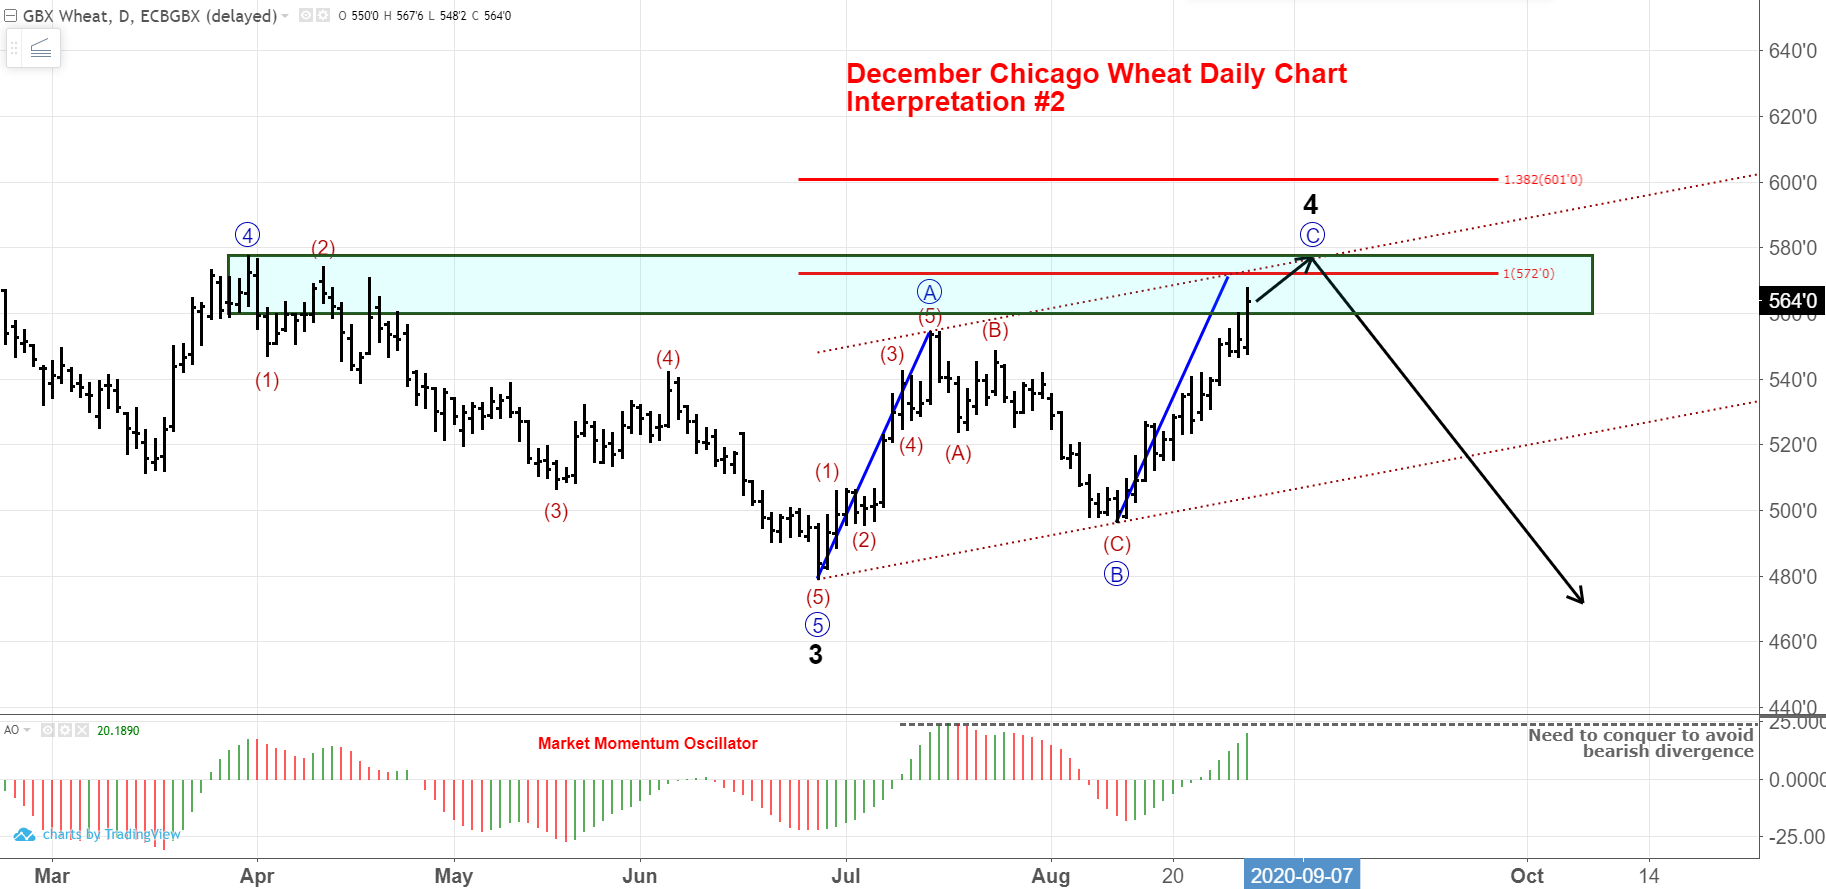
This typically gives birth to alternative weight interpretations with goalposts or hurdles that the market needs to overcome to add confidence to a forecast. Below is an alternate interpretation suggests we are nearing the end of wave C of 4 and the market will turn lower to target $5.00 again in the coming weeks/months. To play devil’s advocate:
- Wave C is approaching the same length as wave A.
- The entire structure from the June 26th low remains parallel lines.
- The slope of wave C is not as steep as the slope seen in wave A.
- Prices are in the territory of the previous 4th wave terminus.
- Momentum of the current advance is currently less than the momentum seen in the initial advance.
These are all characteristics of a correction and have cause for concern. But, the current wave higher has yet to play out.
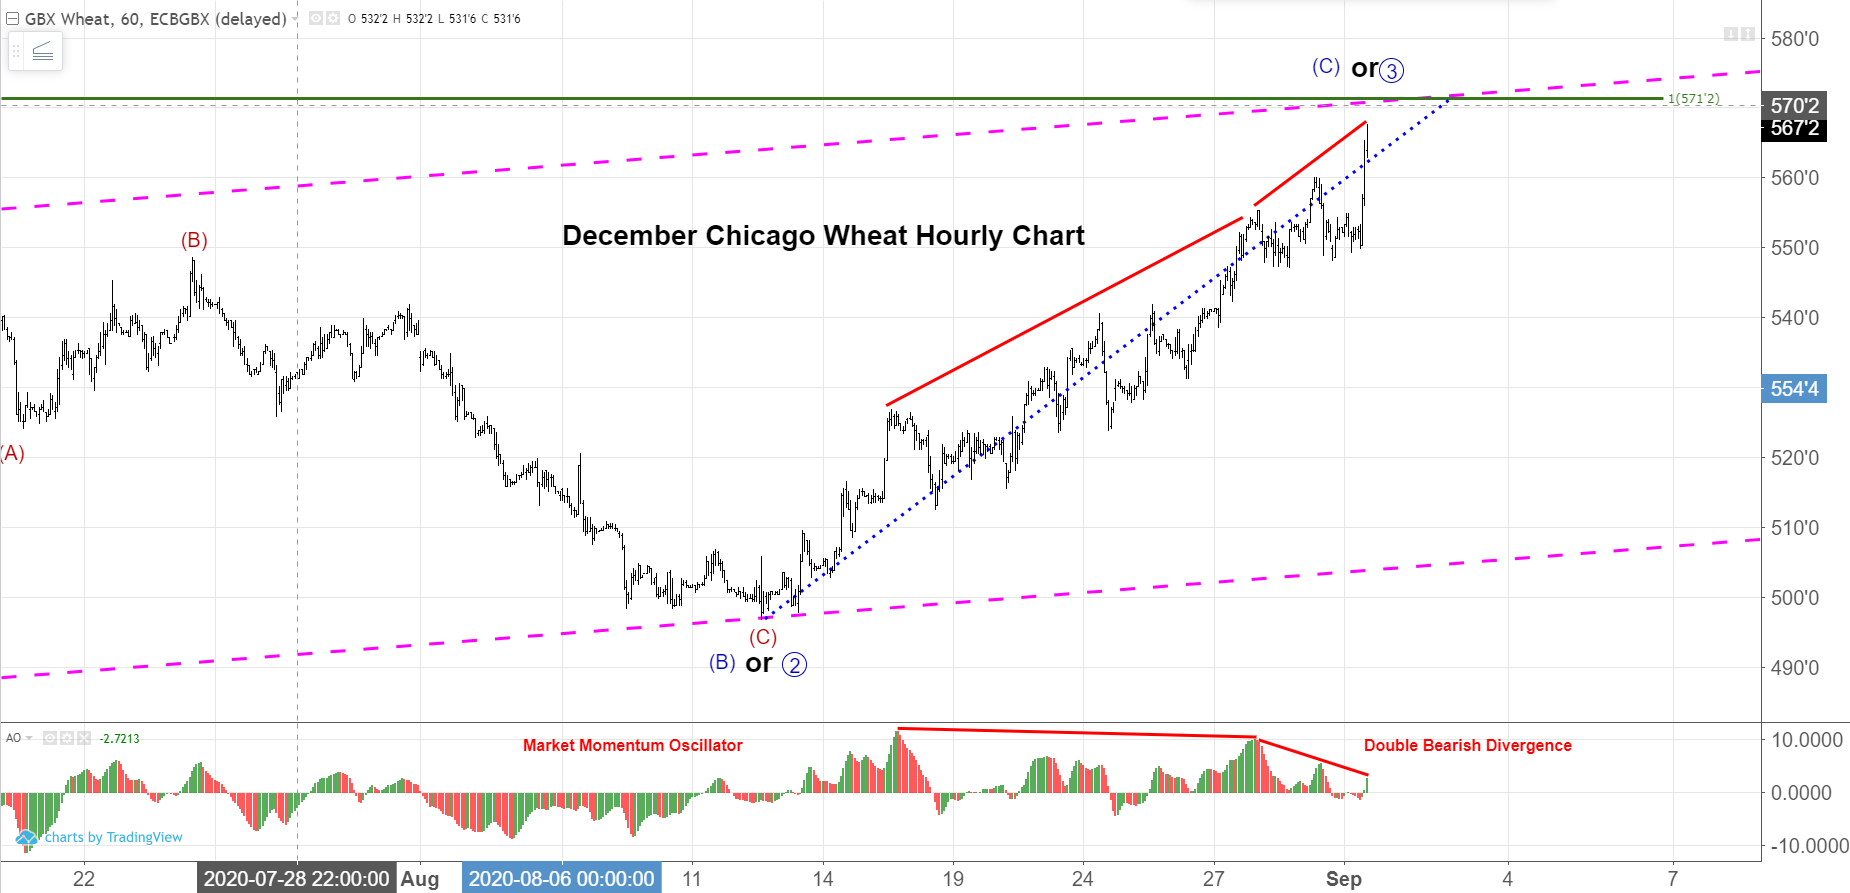
Zooming in on an hourly chart, we can add some goalposts or benchmarks for the market to achieve to add confidence to the main interpretation (much more bullish) or start to fail to achieve and push the probability to the alternate interpretation (bearish in the immediate).
Need to see:
- Prices start advancing at a steeper slope than experience in the initial rally (defined by the dotted, blue trend line). The most recent action appears to be doing so.
- Prices take out the pink, dotted line that is the upper boundary of the corrective price channel in firm fashion.
- Prices advance well above the 1.0 Fibonacci multiple level of $5.71 (green line).
- Momentum continues to grow as price moves higher.
if these benchmarks are met, the near-term forecast of $6.40 becomes much more probable. If the market becomes exhausted near current levels this week, then probability may start shifting to the alternative interpretation. It would not call for a rejection of the preferred wave count. But, caution would be applied to making bullish decisions.
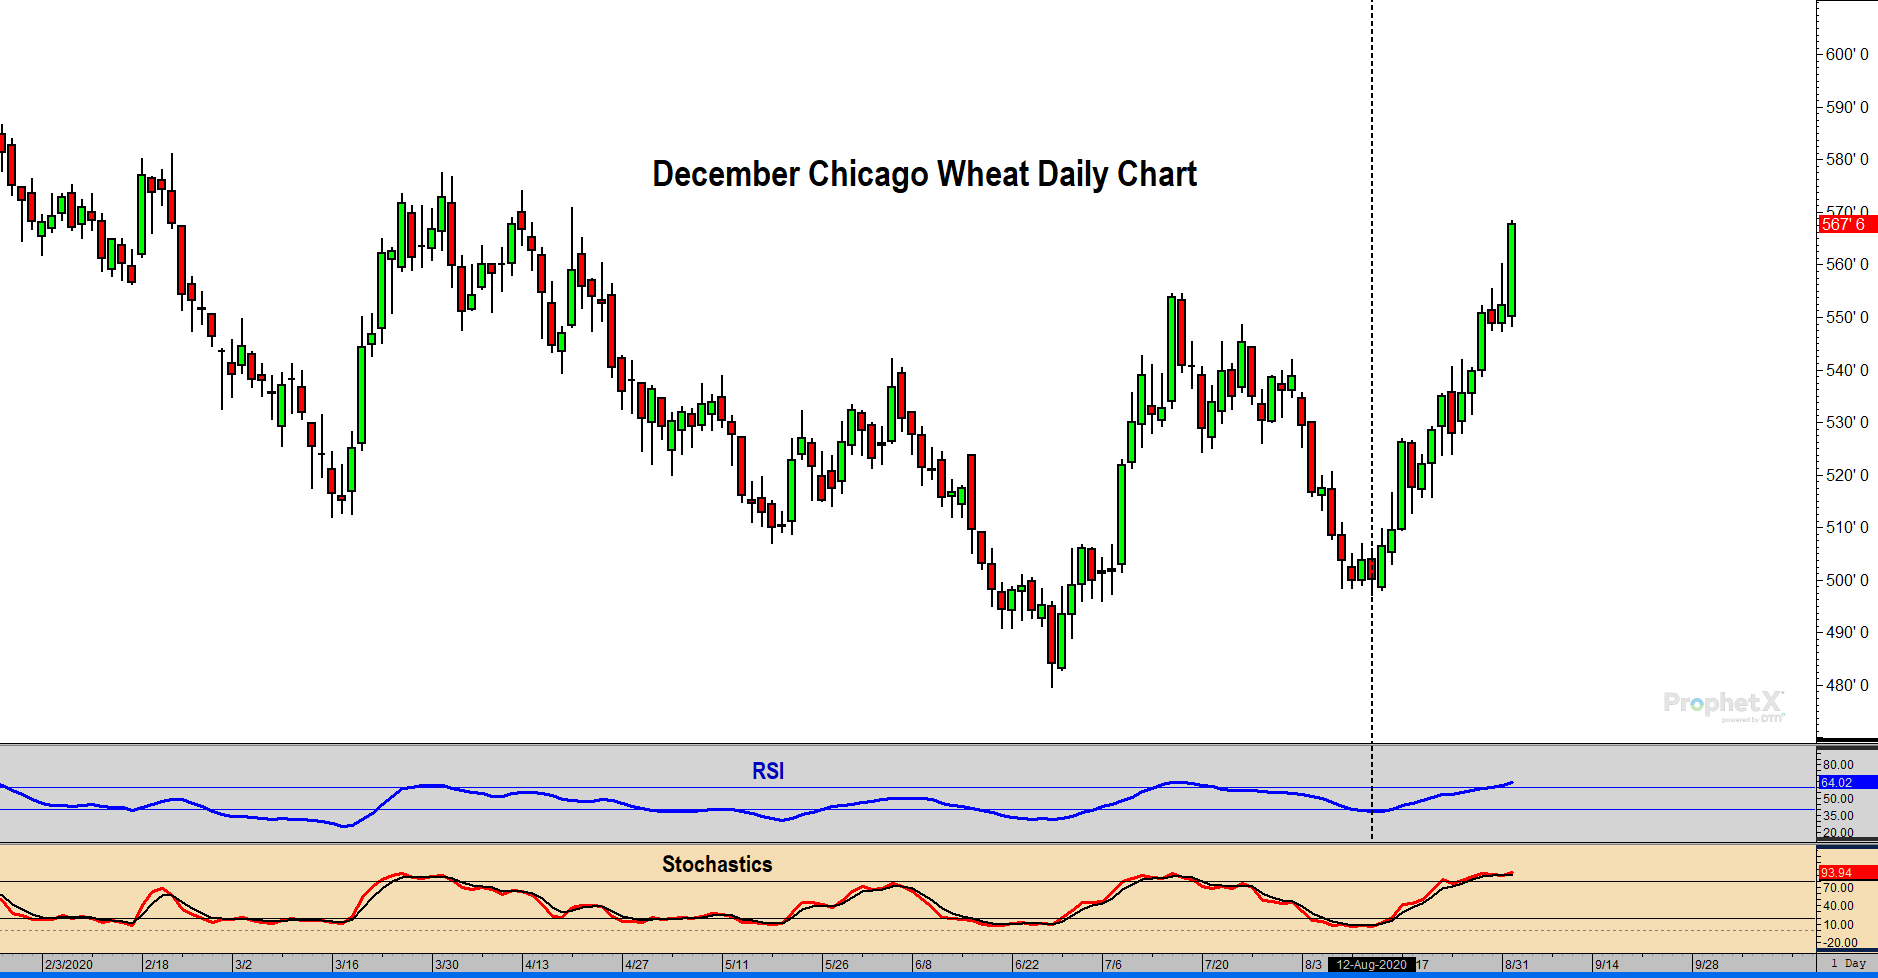
Looking at more traditional technical indicators, we can find supportive evidence for the original and preferred wave count:
- The RSI has once again gone above the 60 level. A good sign the previous downtrend is over. As noted in the prior post, the 40-level held as support on the wave 2 decline, adding confidence to the buying opportunity.
- Stochastics are in overbought territory, but continues to rise and has yet to show any divergence.
- Trend is up.
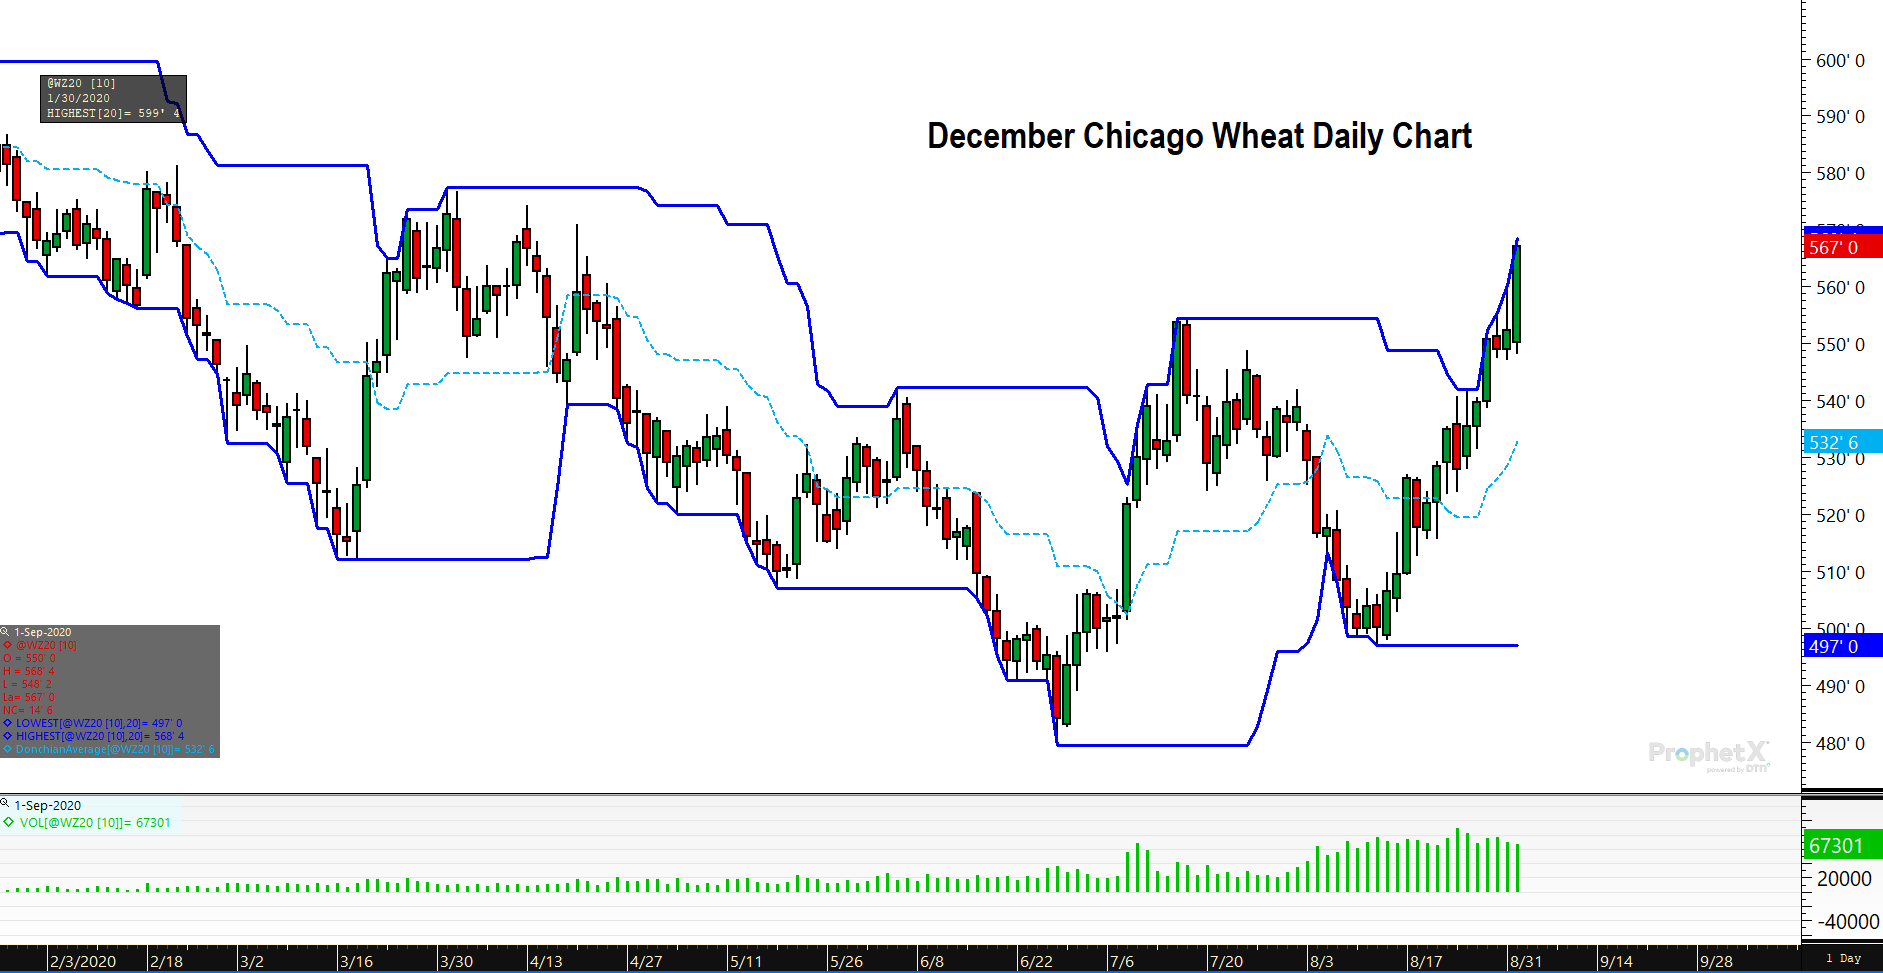
Below is a daily chart for Chicago Wheat December contract:
- Monday’s bullish engulfing candle suggests we see at least 3-5 days of higher prices (Tuesday abided).
- Tuesday’s candle show the bulls have a strong hold on the trend and are in control.
- Prices are pushing the upper boundary of the Donchian price channel – a bullish sign.
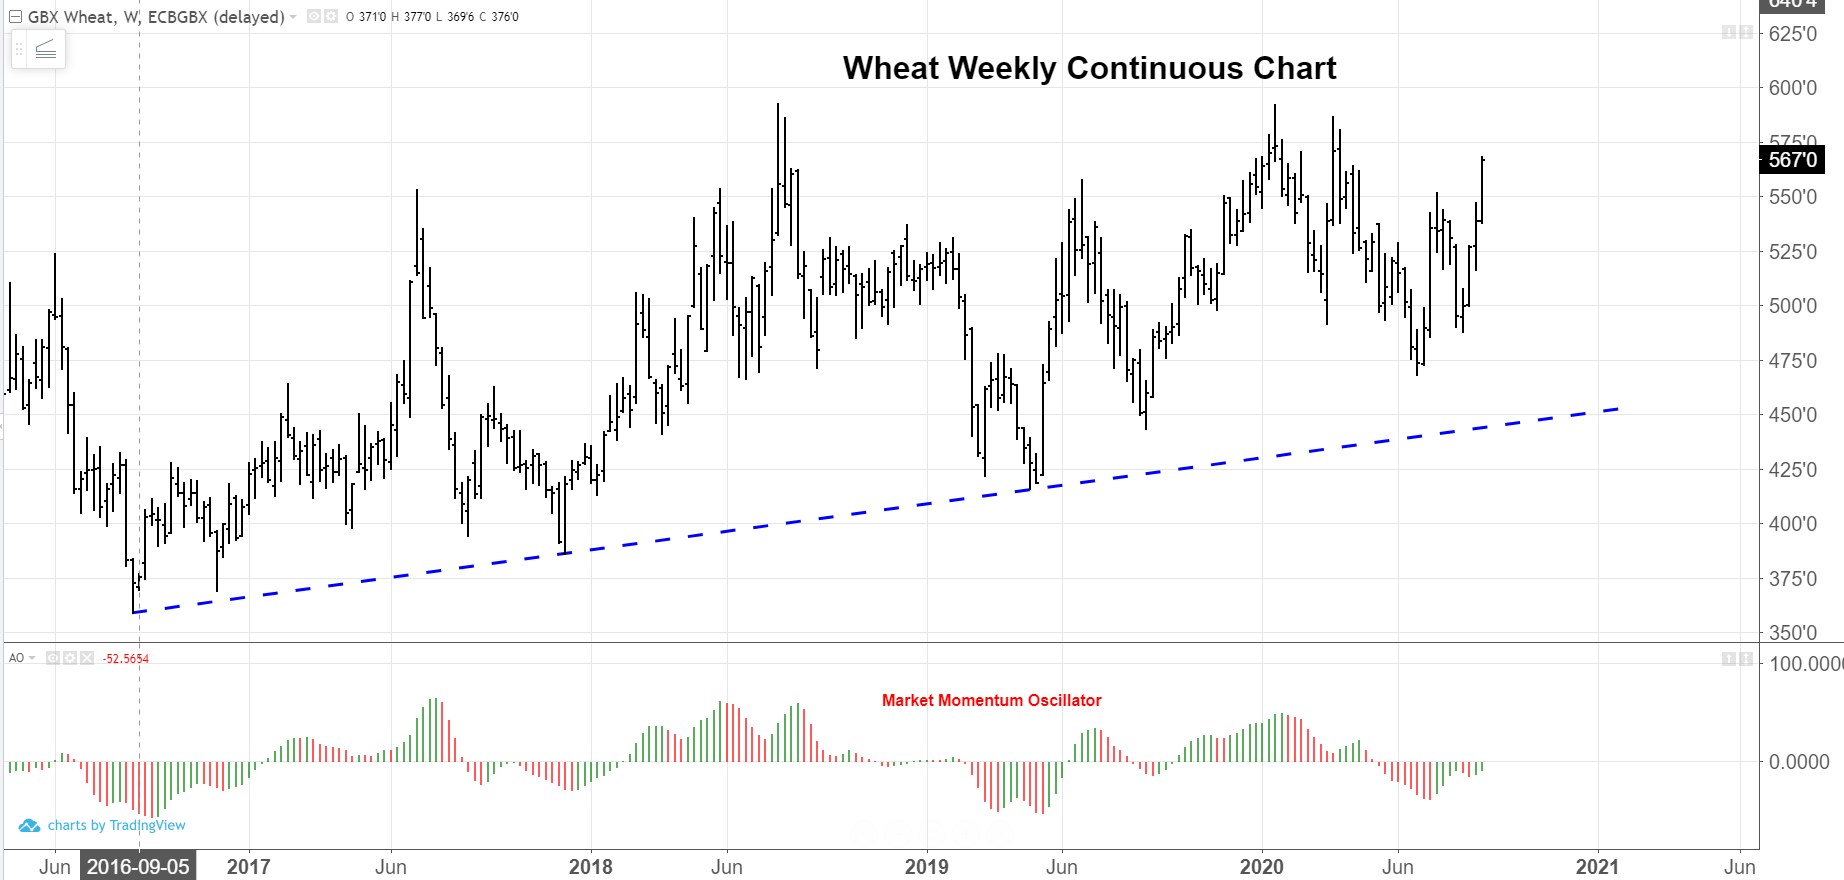
Taking a long-term view, you can see the long-term trend is up as defined by the long term trend line.
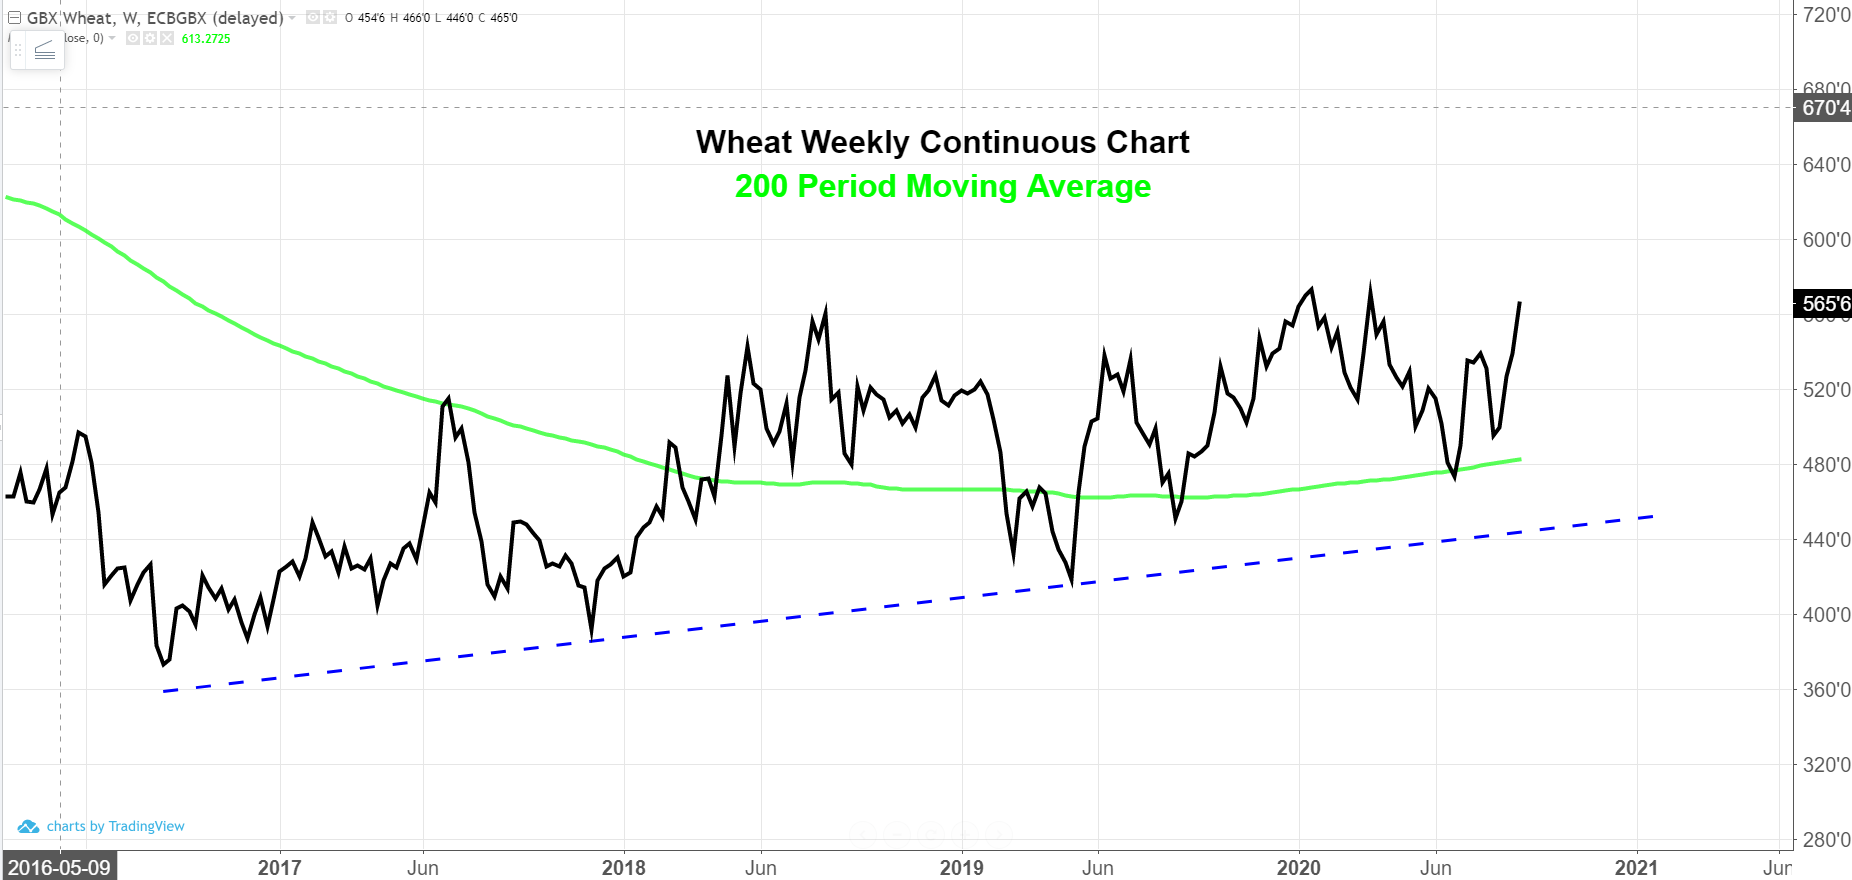
The 200-period moving average on the weekly chart now has a rising slope. Any price retracement back near the average should be deemed as long-term buying opportunities.
The Wheat Buyers’ Perspective:
Long-term trend continues to be up. If prices move out and above the corrective price channel with speed (see chart 1), we will become more emboldened with our primary forecast developed in previous posts that calls for Chicago Wheat prices to target $6.80-$7.00. If prices fail to take out the marked goalposts, chances are we will retreat back near $5.00. This will be a fortunate event for buyer’s who have not locked in long-term coverage and an excellent second change to extend coverage. Long-term trend remains higher regardless of price action in the coming days. The long-term trend is only in doubt if prices go below the 200 day moving average and is negated if prices take out the blue, dotted trend line seen on the weekly charts.
The Latest Wheat Fundamental Information:
- There are few trouble spots around the world with regard to wheat production, but the European Union’s 27 countries with usable common wheat production now expected at 113.5 million tonnes, down from the 116.6 million estimated a month ago.
- Russia’s wheat production ideas are on the upswing, with consultant Sov Econ raising production to 81.2 mmt. That compares to 78 mmt from the USDA and would be nearly 8 mmt above a year ago.
- A combination of increasing Russian production; U.S. wheat being overpriced in global markets; and, the sharp fall in the Russian ruble has given the world’s number one wheat exporter another edge versus the U.S.
- According to Ag Resource, Canada still has a shot at record production despite the recent heat wave in the Canadian Prairies.
- The only wrinkle in the bearish record global ending stocks is major exporter country ending stocks are forecast to dip to 62.08 million metric tons (mmt) in 2020/21, which would be the lowest since 2013/14.
- The recent supportive influence seems more about funds, short each of the wheat markets, covering those shorts. Additionally, the recently bullish corn market and rumors of China buying interest have been cited as support.
- Despite the lack of confirmation last week, traders continue to fuel the China interest story, expecting China to show up as a buyer of U.S. hard wheat. China has been a better buyer of wheat so far this year, taking a total of 4.28 mmt in the January through July period. That is up 16.3% versus a year ago, according to customs data.
- The US spring wheat harvest is progressing well, moving past the 50% completion mark last week. Recently some quality issues have been talked about in North Dakota, such as sprout and low test weights. With U.S. spring wheat harvest just 50% done, and North Dakota at 39% as of Sunday, heavy rains are projected to fall in North Dakota in coming days, likely delaying an already late harvest and causing quality concerns.
- The spring wheat portion of that was just under 26 mmt. Canada’s stocks report will come out on Friday. Part of recent wheat strength has emanated from the Black Sea, where cash values for both Russian and Ukraine wheat have surged, with consultancy IKAR saying Russian cash values rose $9/mt on Monday.
- Also bullish for wheat is word from the EU that their wheat exports are likely to fall to just 25 mmt from 38 mmt a year ago. Russia’s wheat crop was increased from 82.5 mmt to 82.8 mmt by IKAT, and that is well above USDA’s 78 mmt August estimate.
- Pakistan bought 320,000 mt of optional-origin wheat on a much larger 1.5 mmt tender, while both Jordan and Syria return for tenders this week. U.S. wheat inspections last week kept total inspections 2% higher than a year ago.
- U.S. spring wheat harvest moved up 20 points to 69% done, with North Dakota and Washington the laggards. North Dakota is just 59% done compared to the average of 75% at this time of year. Kansas City December wheat will likely find heavy selling on a rally toward $4.90.
