Sugar Futures Turning Higher
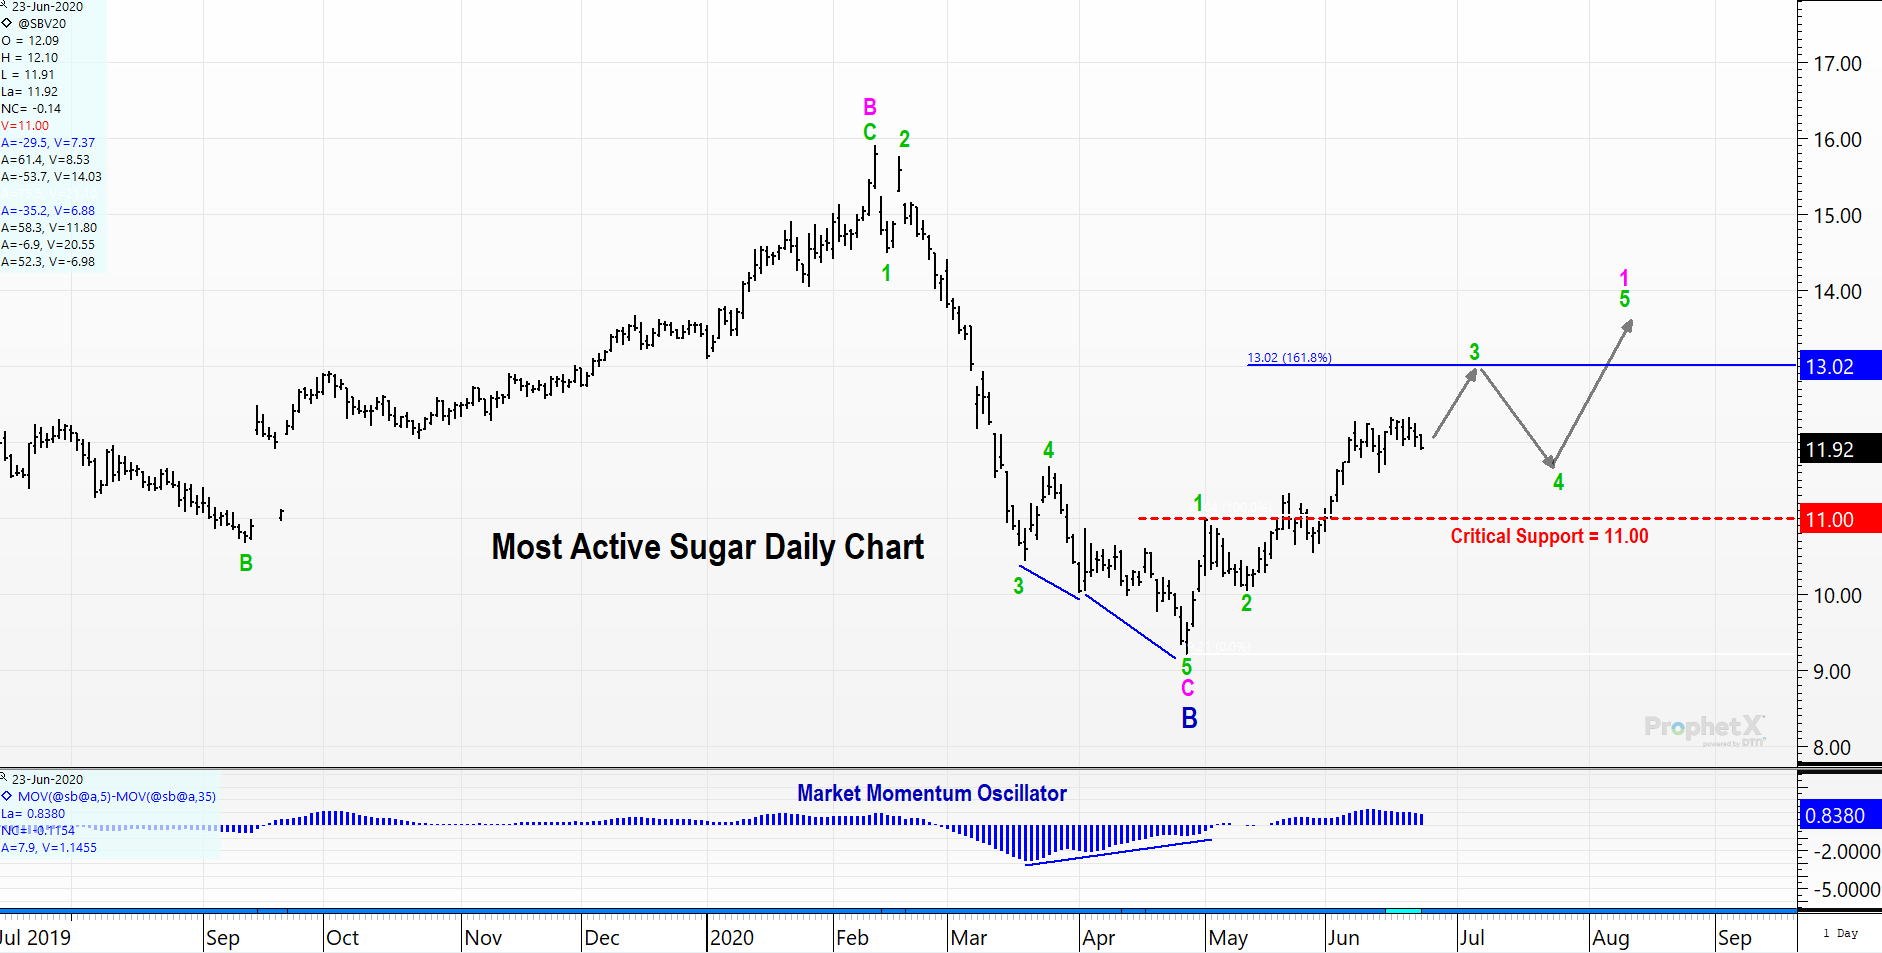
sugar is in the early stages of a longer-term uptrend. Consequently, price pullbacks should be considered buying opportunities. Buyers that lack current coverage should be aggressive in extending coverage to take upside risk off the table. Below is a daily chart with our current wave count. We expect the market to zig-zag (Waves 3, 4, & 5) up to complete Wave 1. This should set the table for a 50-62% retracement in wave 2 back near 11.00-11.50 sometime this fall. That will act as a spring board for a much larger rally in wave 3, targeting north of 20.00 (see weekly chart).
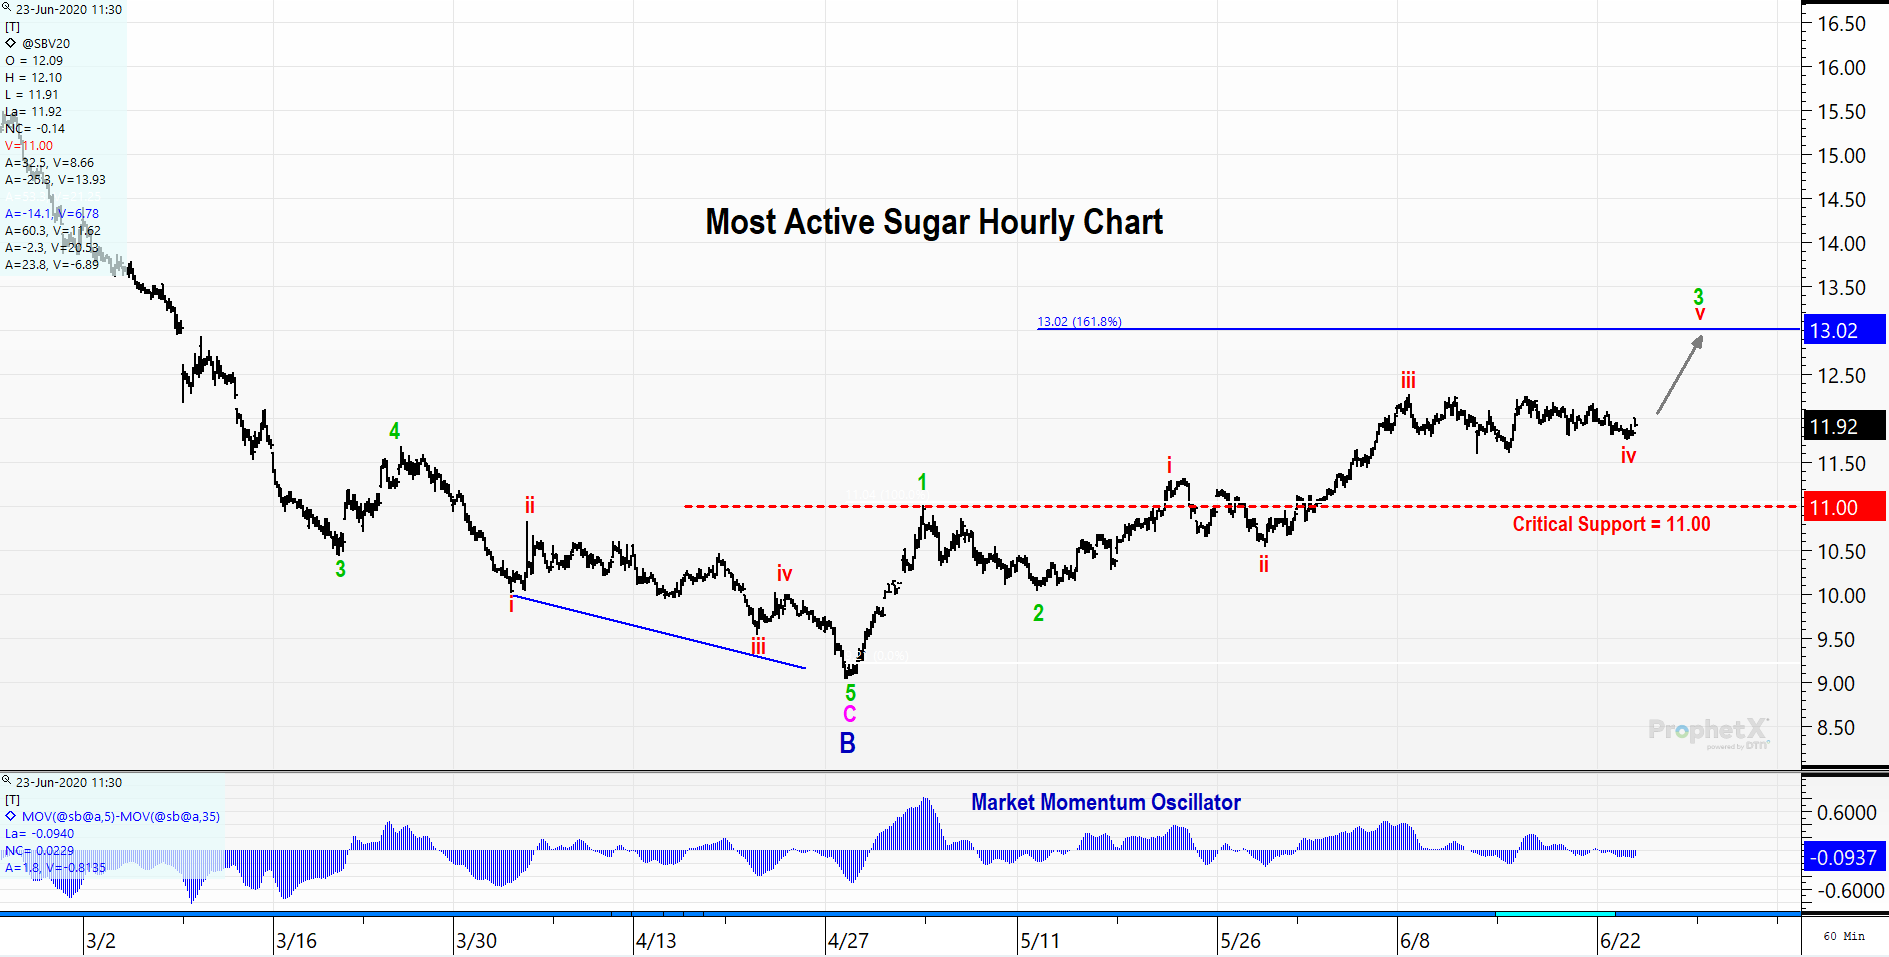
The hourly chart below confirms the substructure of the wave count.
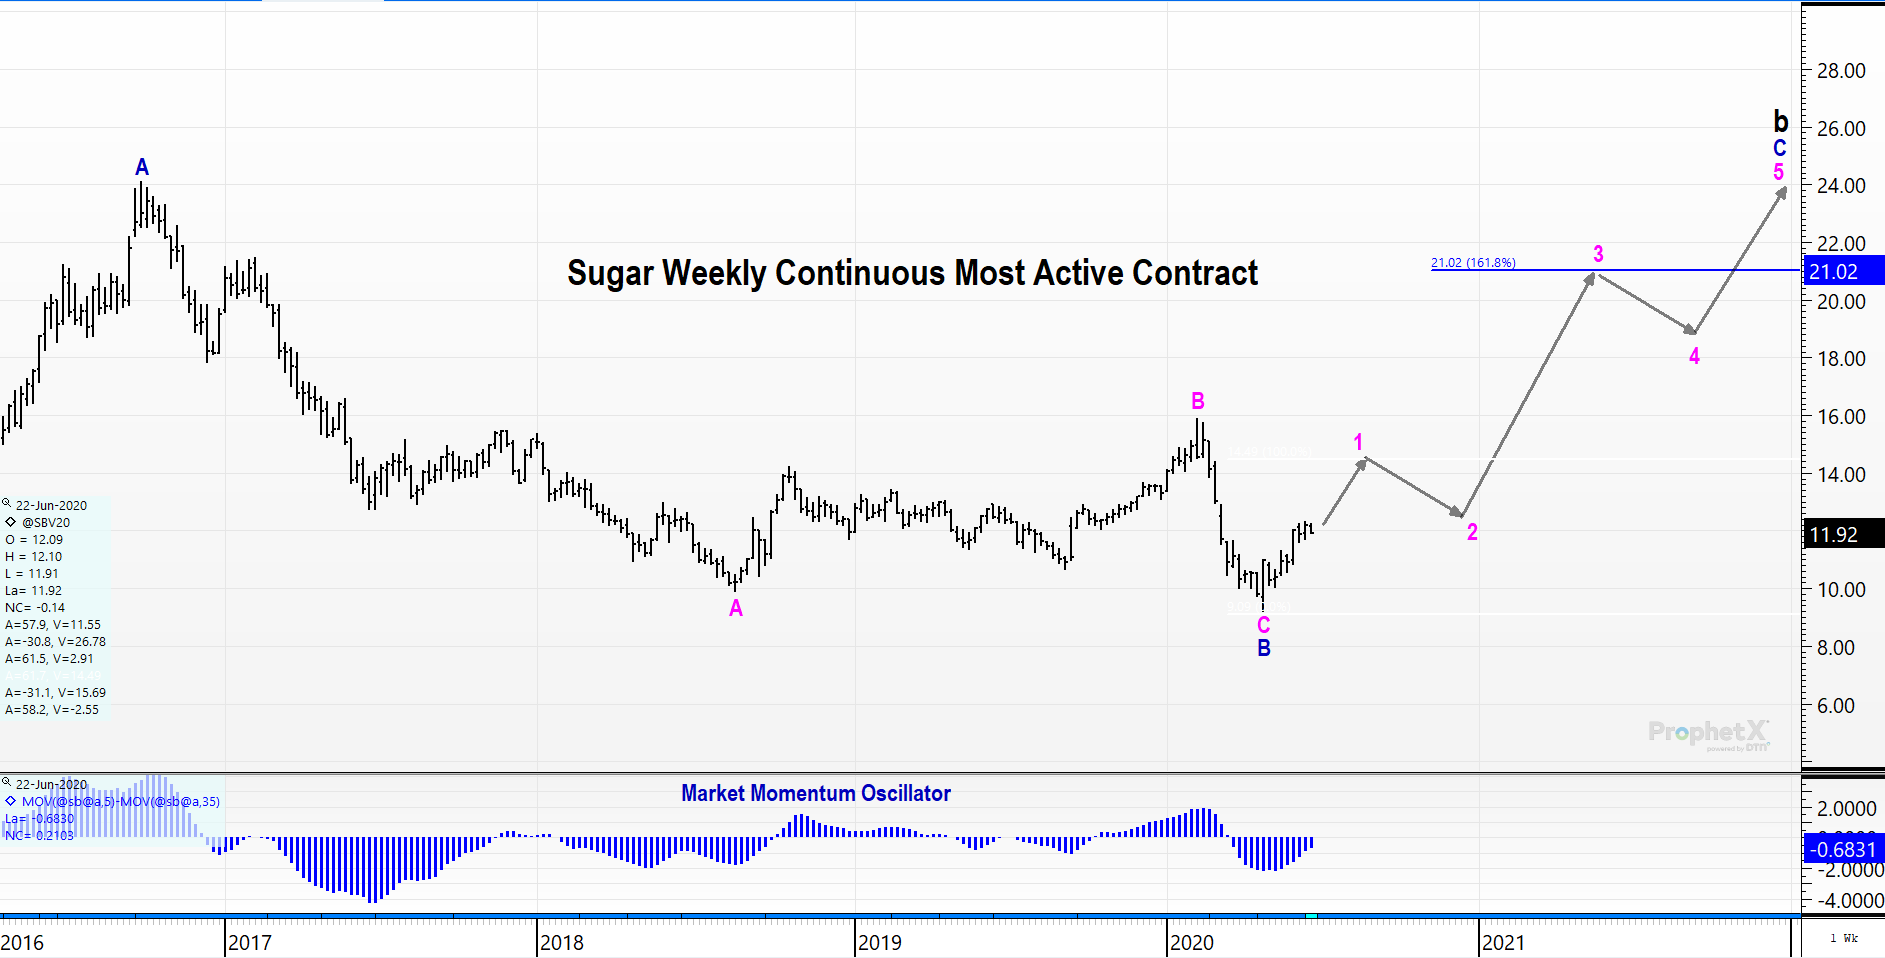
The weekly chart below gives the longer-term perspectives. Moreover, it illustrates the current value the market is offering. Note: for buyers that are currently short in their needs, it is advised that you cover enough of your needs now to avoid disaster if the market takes off running. You don’t have the luxury of waiting for pullbacks. This is because once a trend has turned, you want to be on its side (moves can be more violent and sudden than expected).
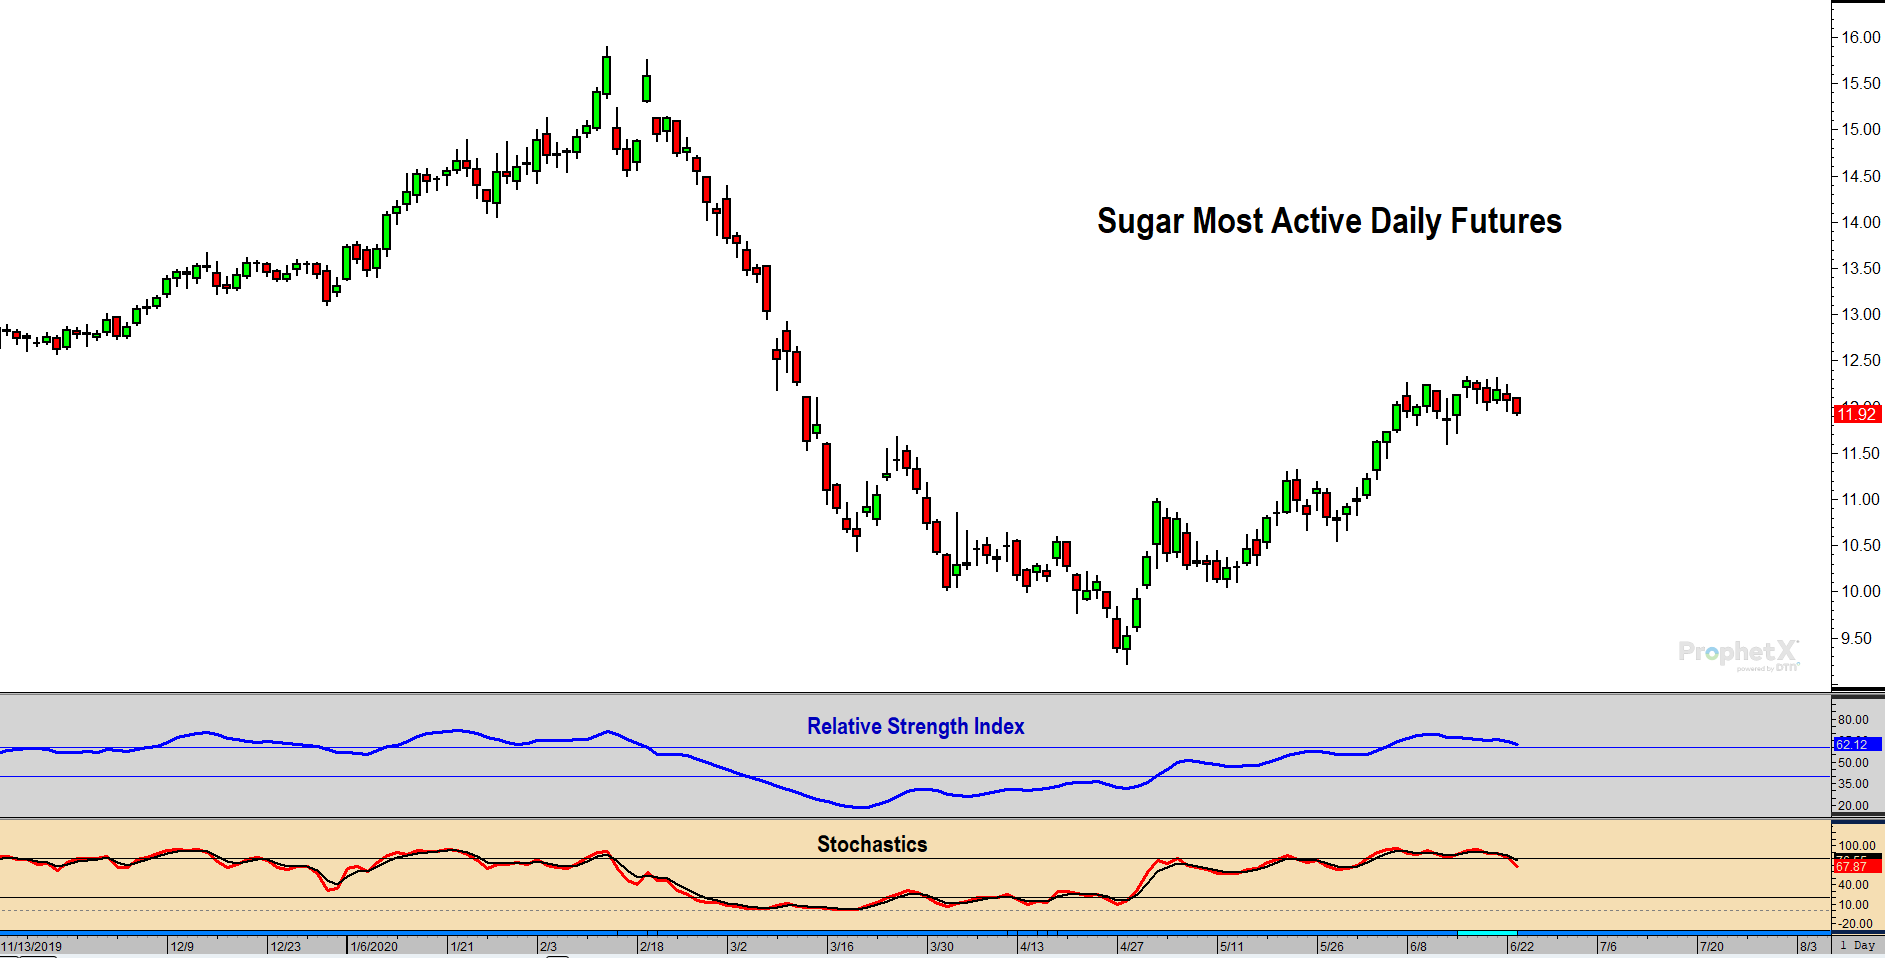
The Relative Strength Index is now well-established above the 60 level. This indicates the previous bear trend is over. Look for RSI to return to the 40 level on price pullbacks and hold. This will signal a large rally is coming.
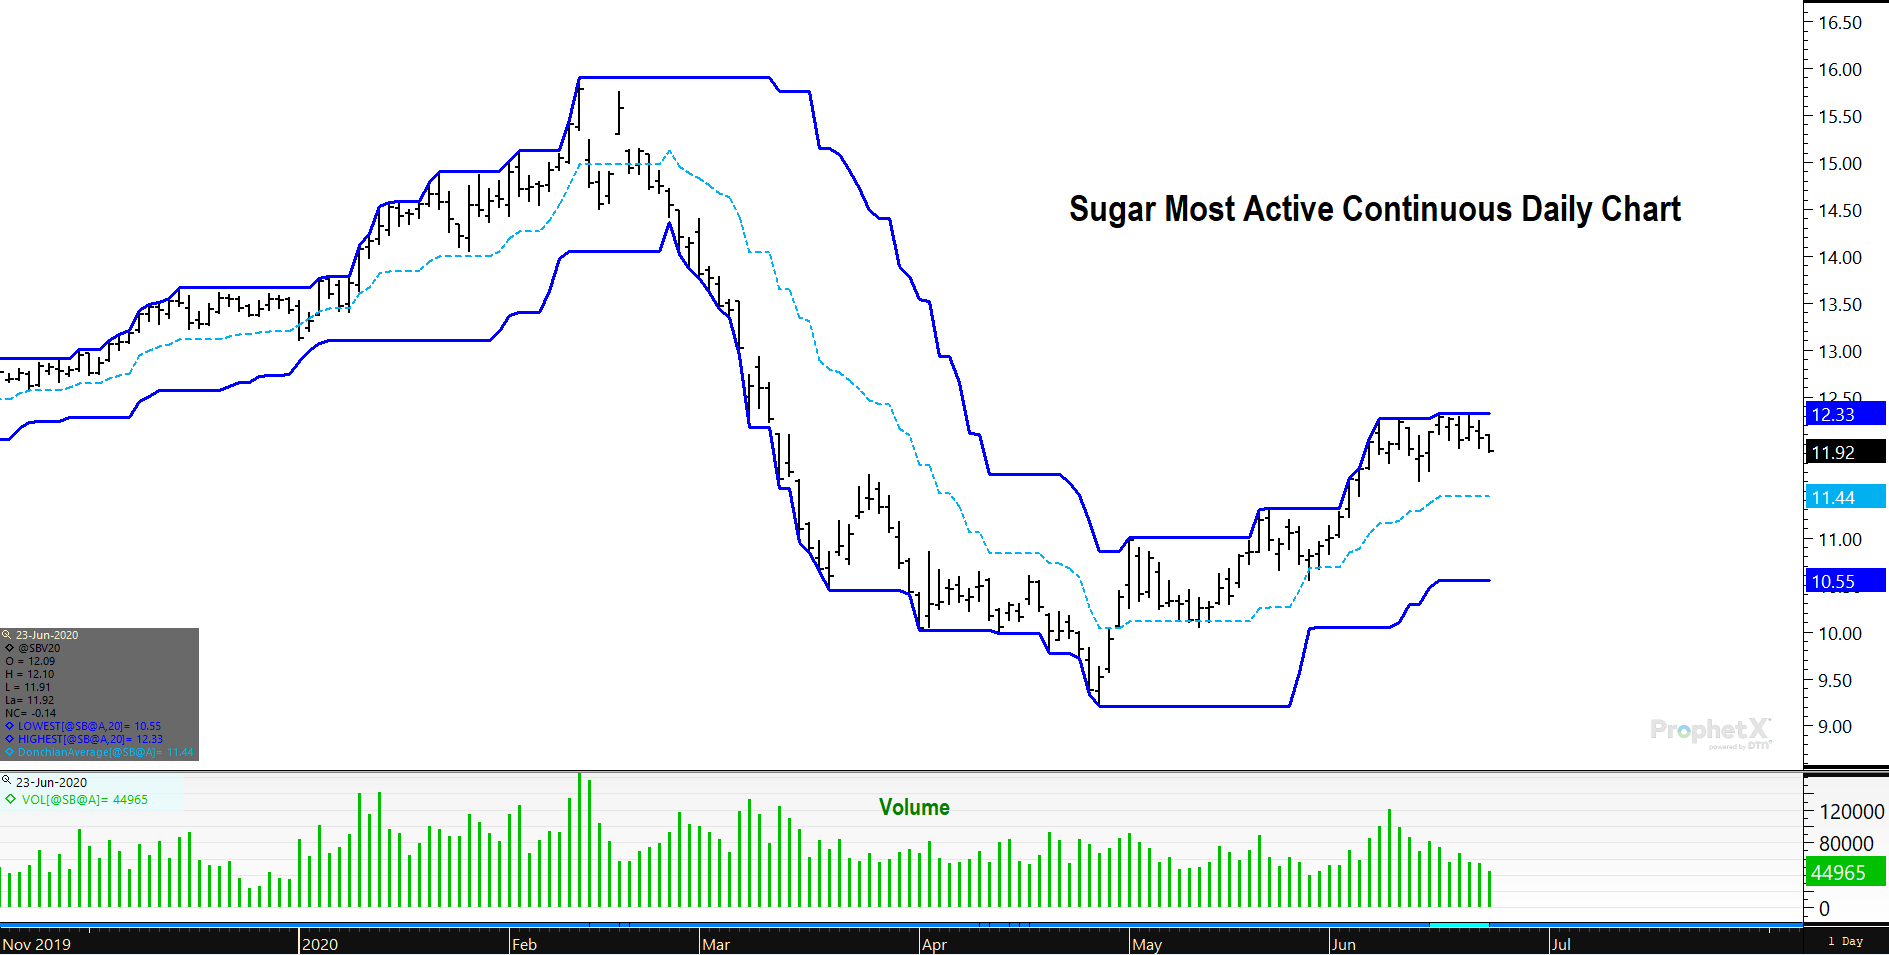
As long as prices stay above the center line of the Donchian average in the chart below, there is no concern being long. Volume has dropped off the past couple of weeks, suggesting we may be set to see that pullback in wave 4 of 1.
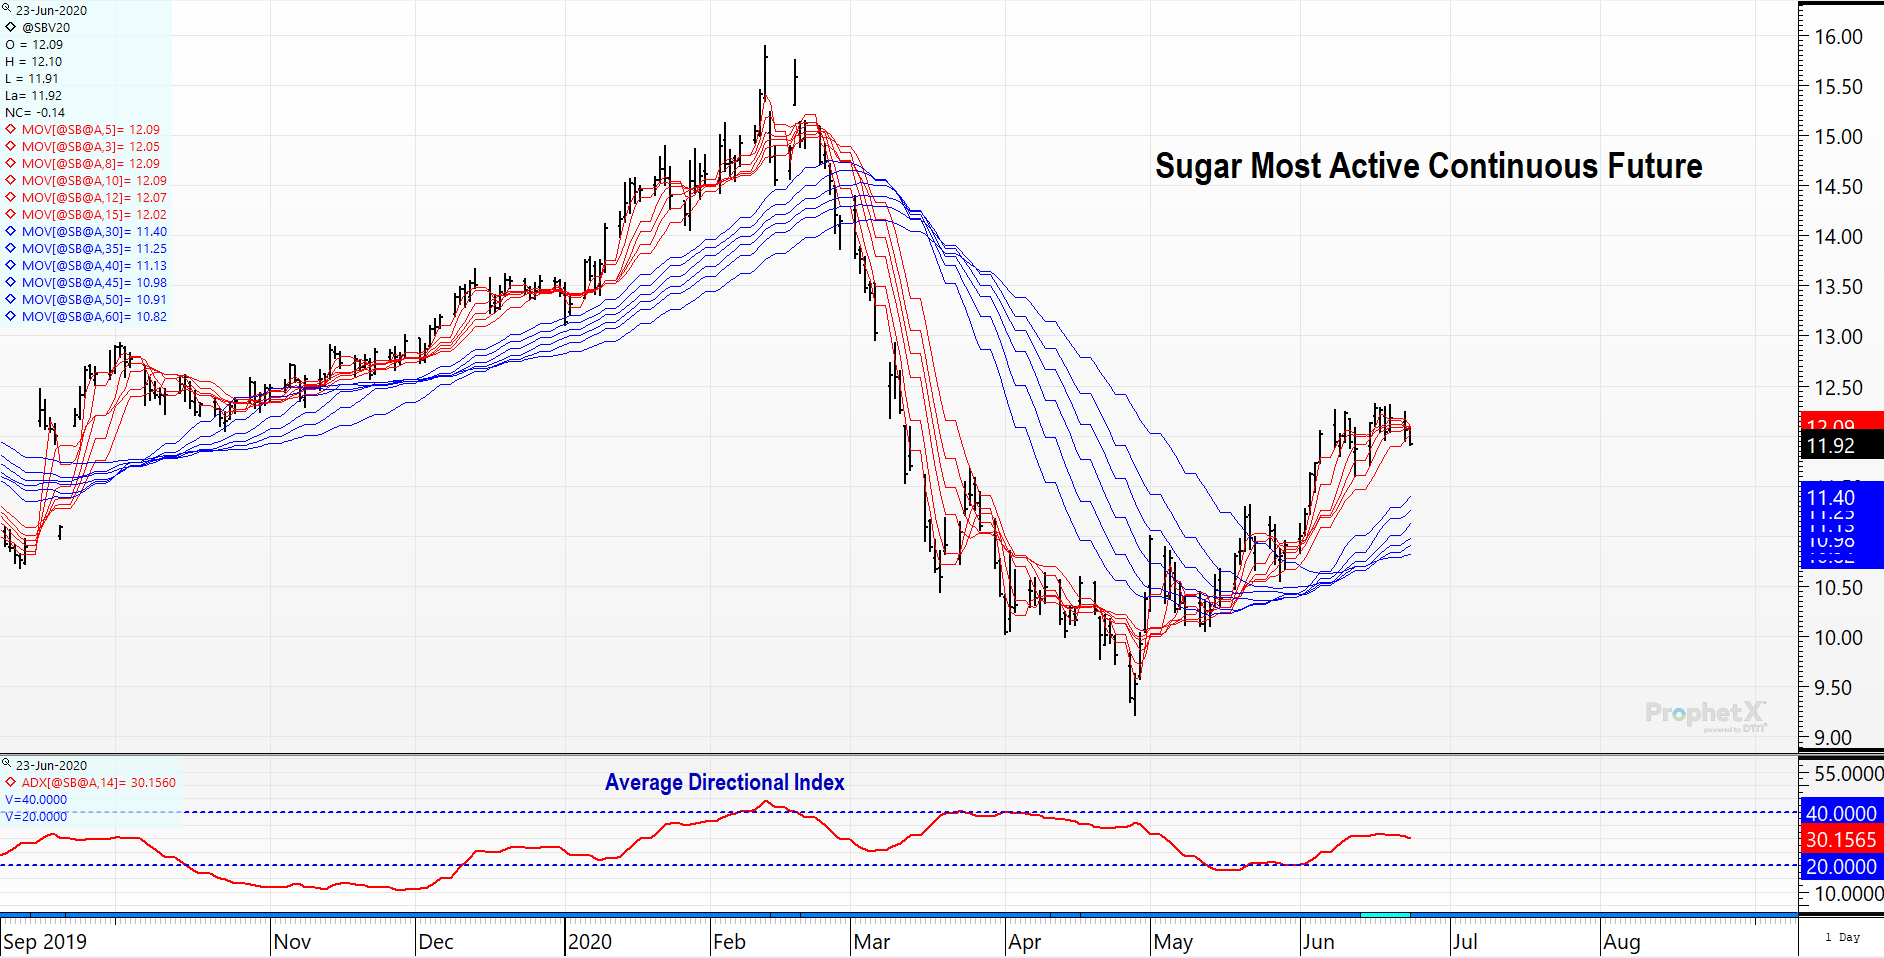
Looking at the multiple moving averages page, we see the long-term moving averages are sloped higher (longer term trend is up). The gap between the short and long term averages may be at its peak in the immediate. Prices may experience a slight pull back and test the support of the long-term averages (in blue). This would be an excellent buying opportunity. The average directional index suggests we are “trending”, but the trend has paused. Again, look at pullbacks as buying opportunities to rejoin the larger trend that is higher.
