Where are Wheat Futures Headed?
Given the recent price action in Chicago Wheat futures, we have adopted the alternate interpretation (the more immediate bullish case).
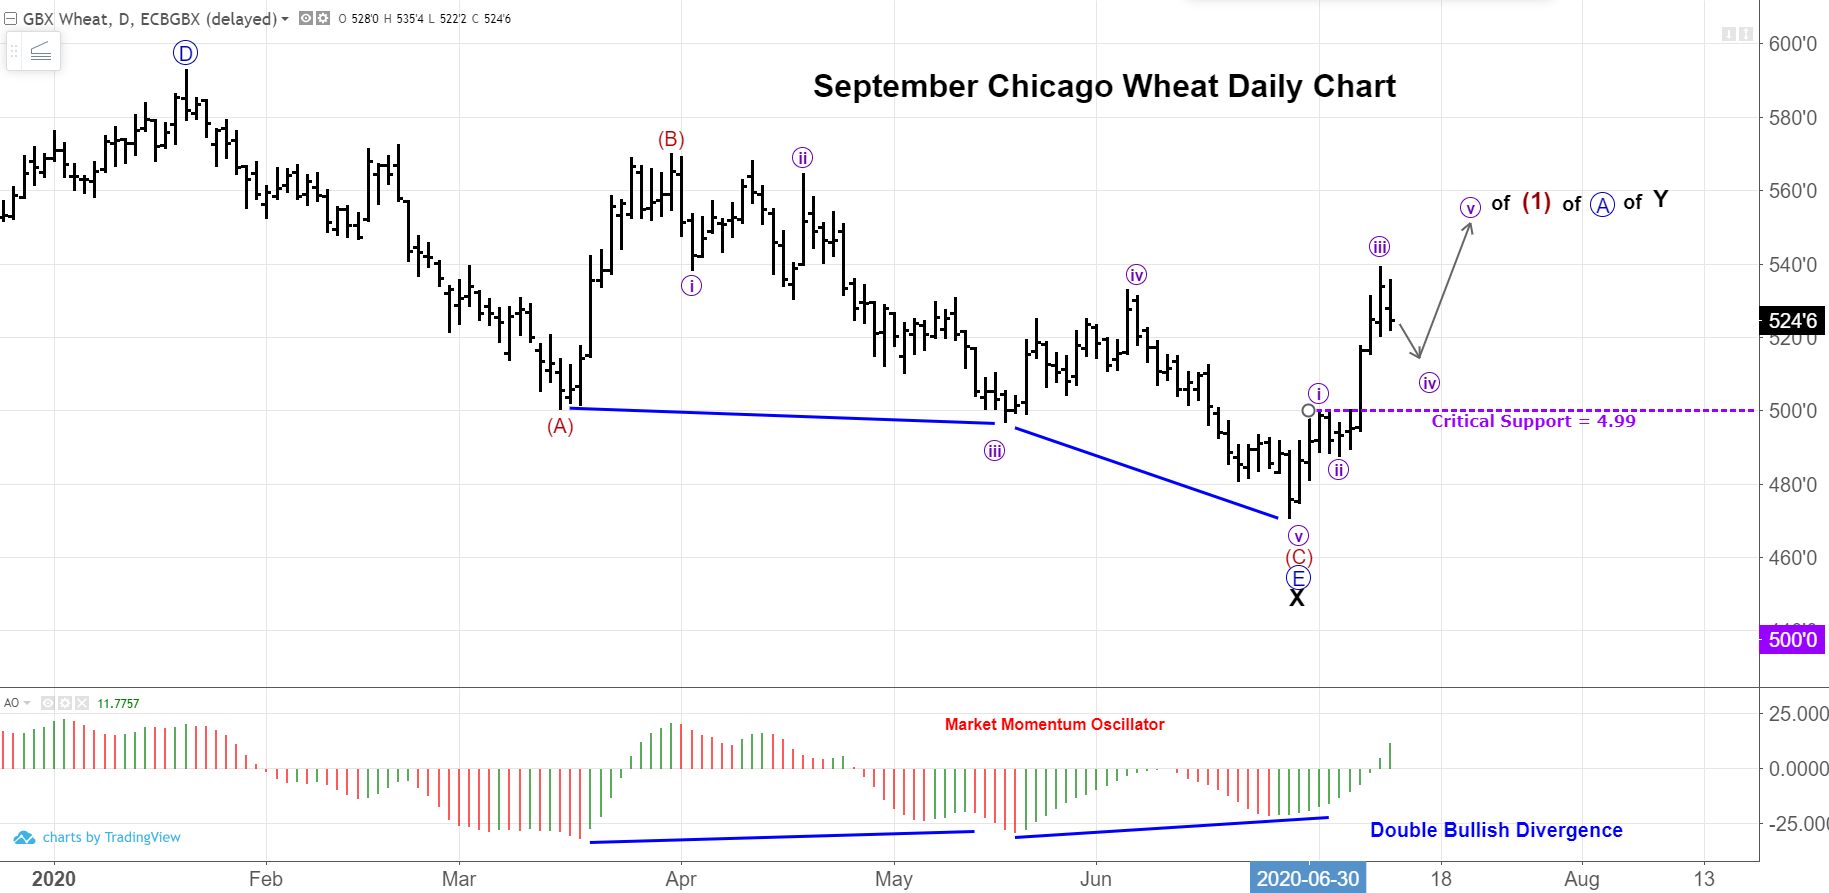
The daily chart below is our expectation of where prices will go. Friday’s close is being analyzed as the end of wave iii. Prices finished a mere quarter cent away from the 1.618 Fibonacci extension target (5.3425) that is most common in third waves. Looking at the momentum oscillator, you can see the double bullish divergence that occurred on the most recent decline. This is a typical signature before a major reversal.
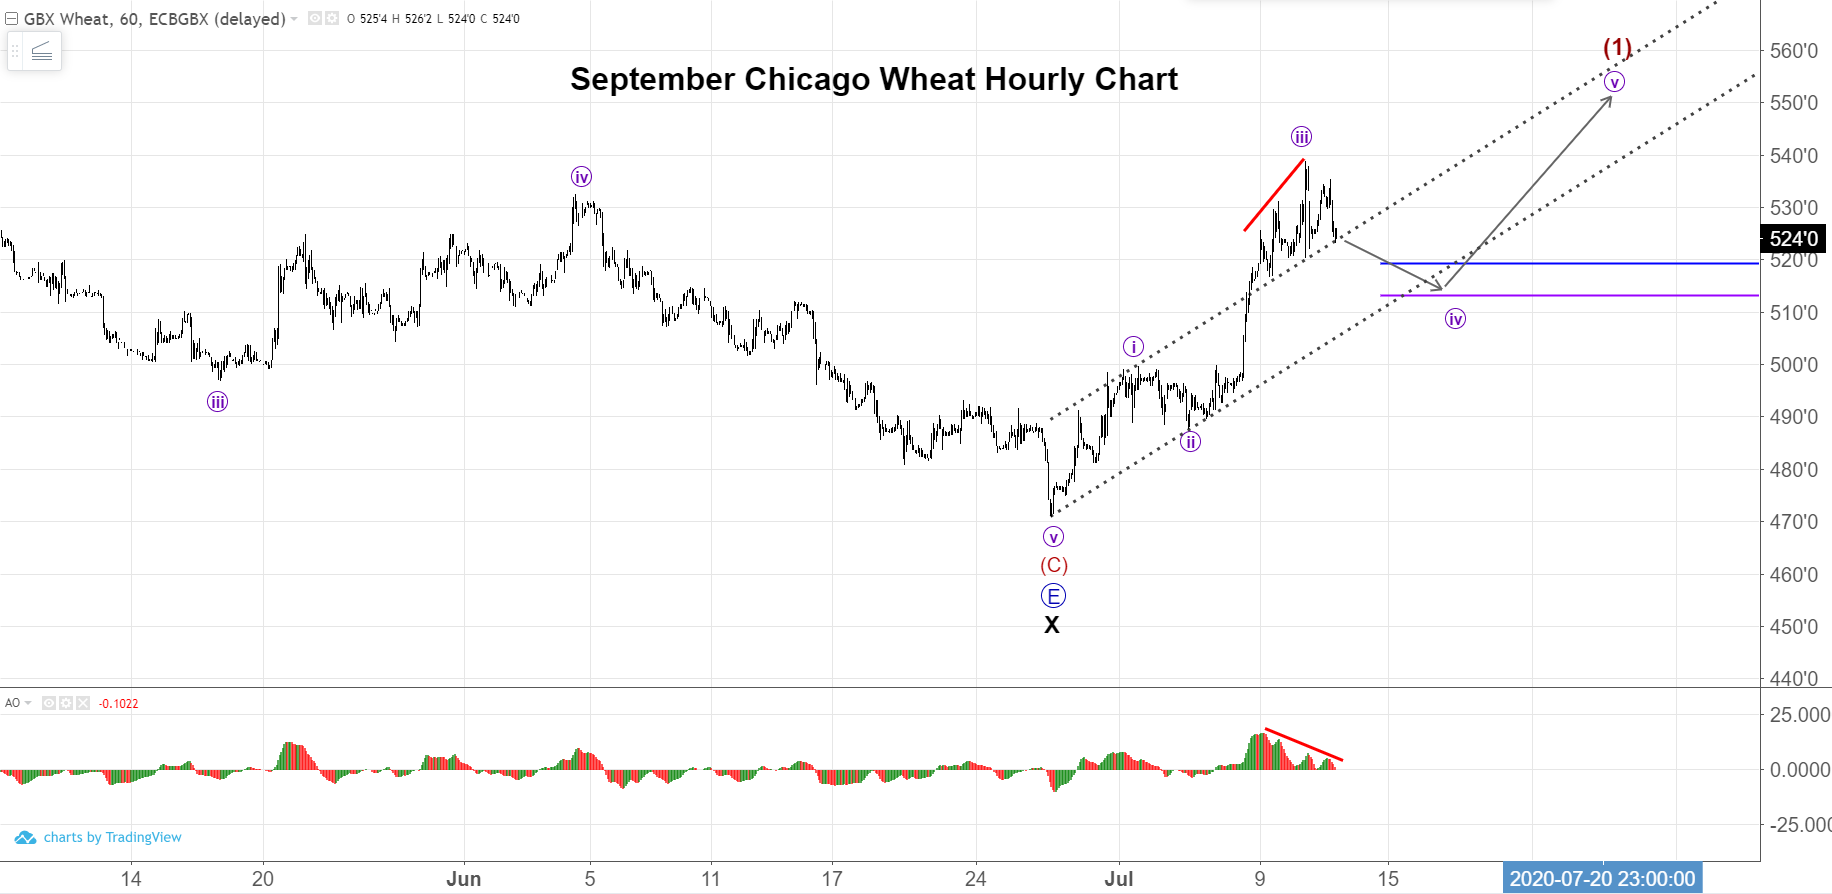
Zooming in on the hourly chart, you can see the bearish divergence accompanying the end of wave iii. Look for wave iv to last about 1 week and retrace 38-50% of wave iii. This is between $5.04-$5.13/bu. This will be an important buying opportunity to join the uptrend on a dip. Looking back at the daily chart, you see the critical support for this interpretation is $4.99. If prices go below that level, it is a rule violation (wave 4 cannot enter wave 1 price territory) of the wave principle and will invalidate the outlook. It is that level that can be used for risk-reward decisions.
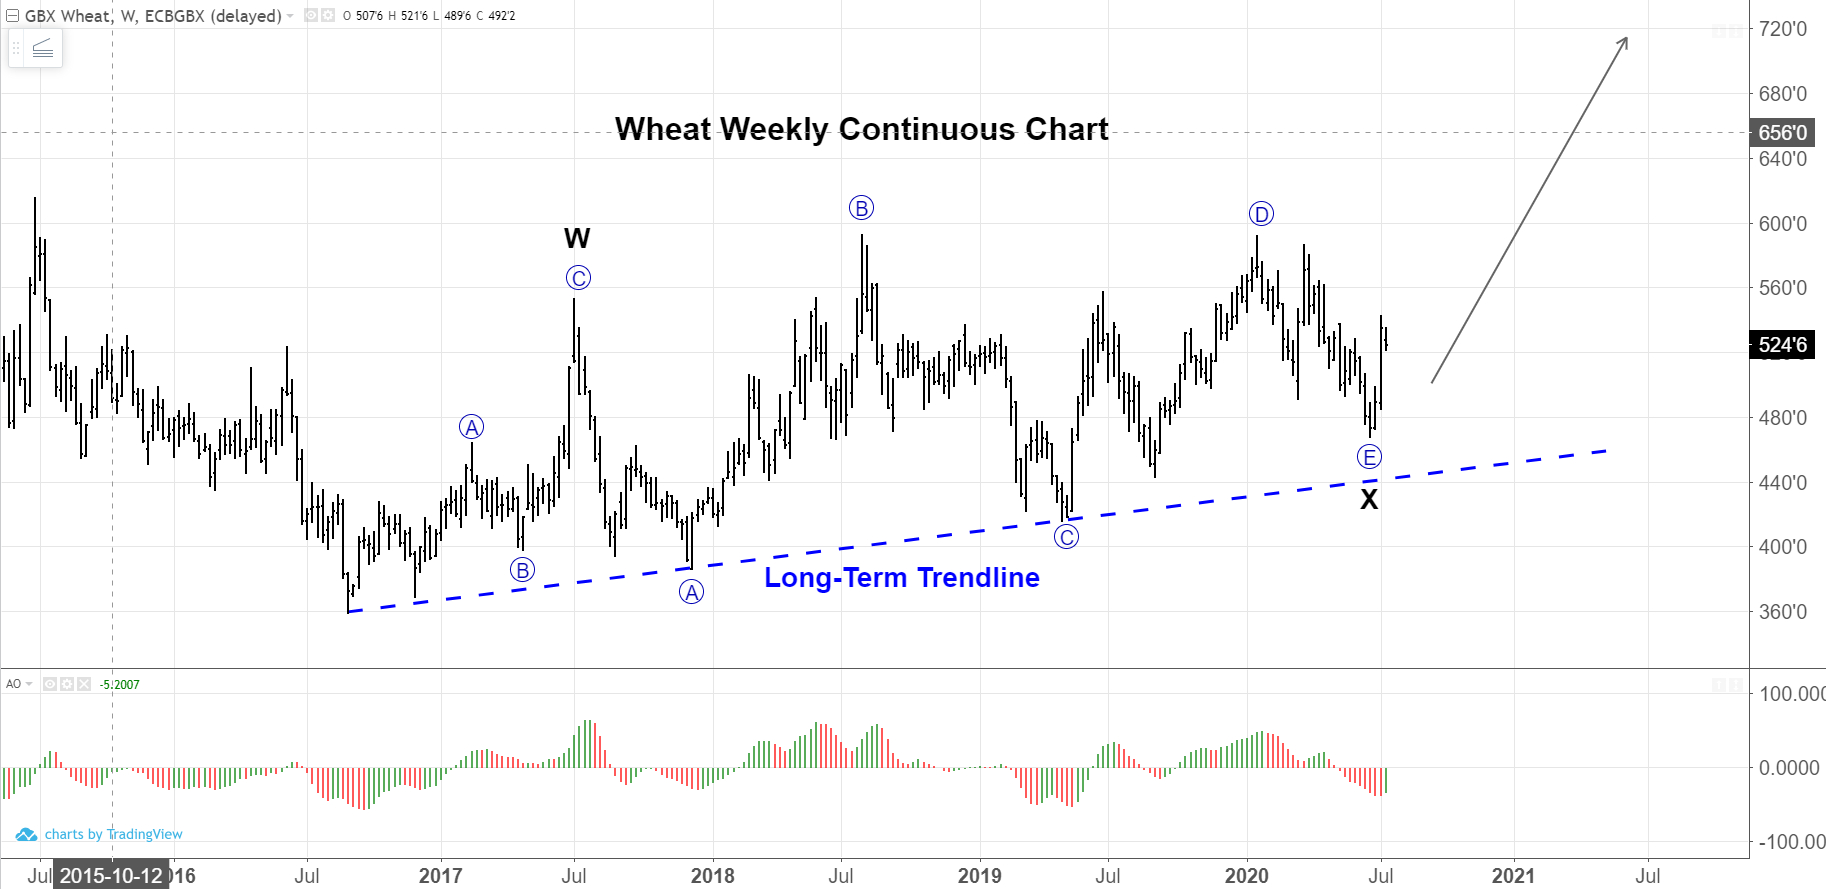
The weekly chart illustrates a well-established long-term trendline, along with the eventual upside target of +$7.00.
Supporting evidence can be found in the following technical studies:
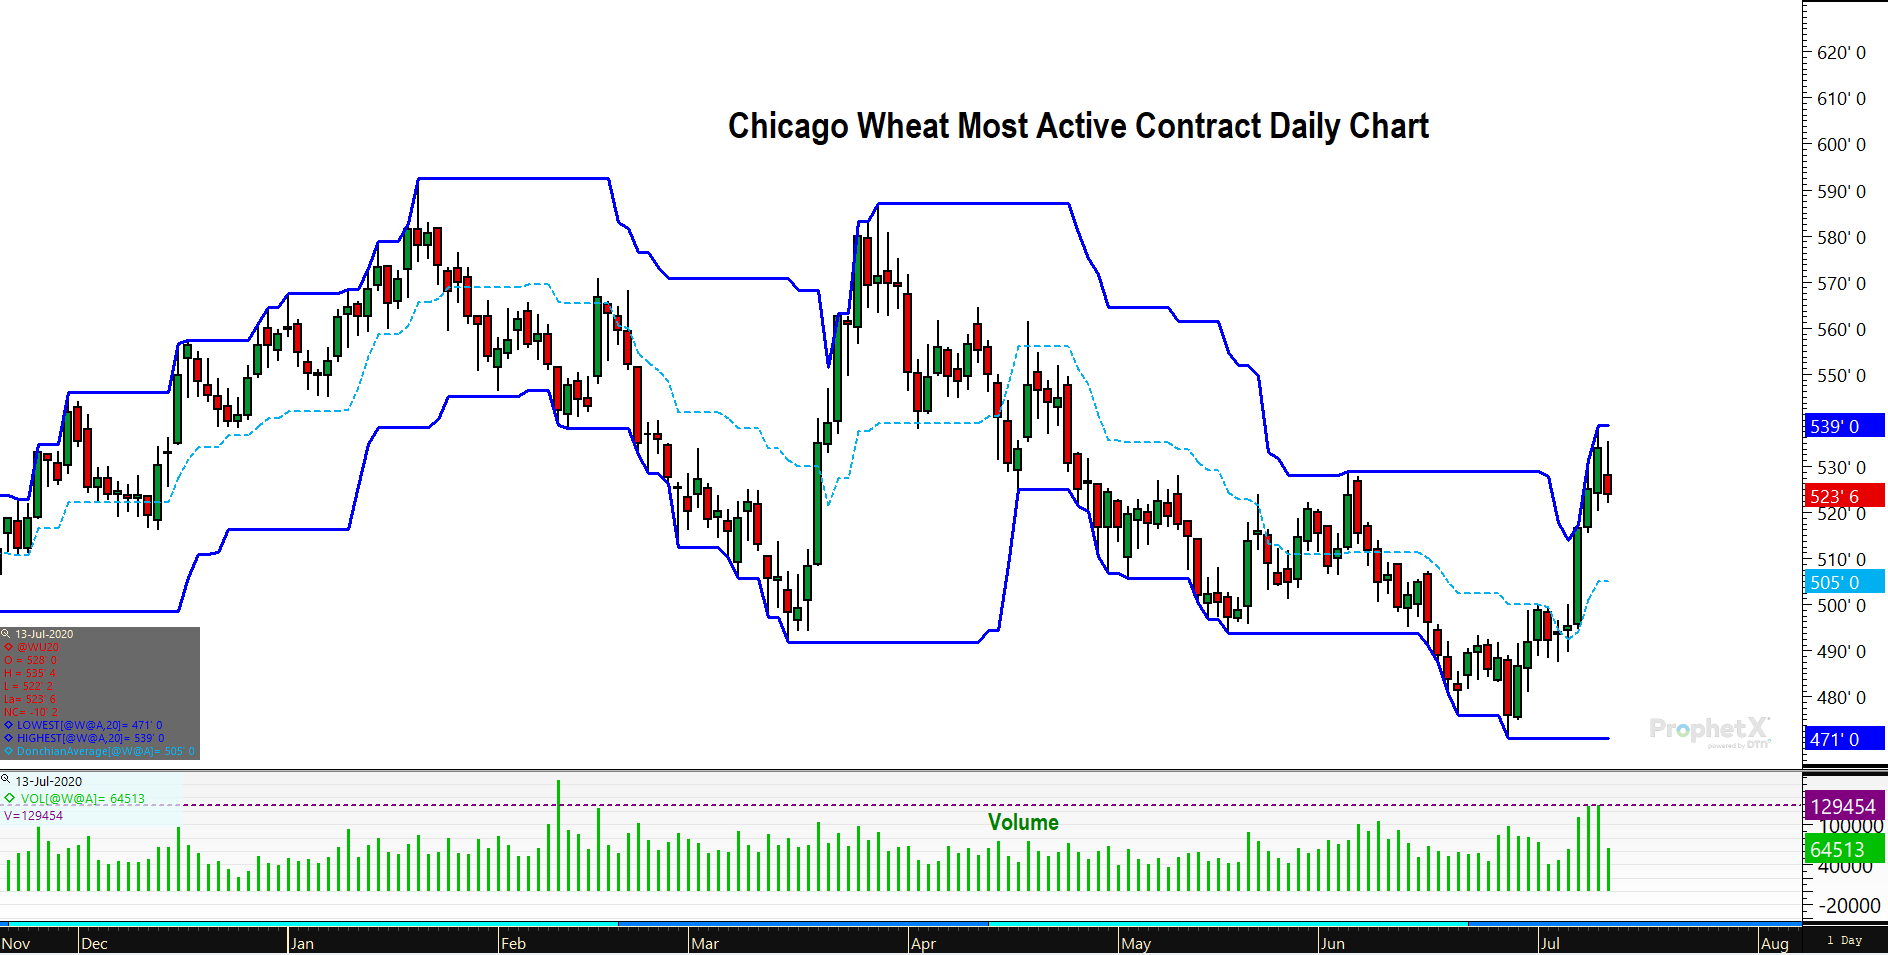
Prices have expanded the Donchian Channel to the upside (a bullish sign) for the first time since late-March. Looking at volume, we saw the two largest volume days last week since February. Both of those days were “up” days. This is a bullish sign. Look for the wave iv pullback to get support from the midline of the Donchian Channel.
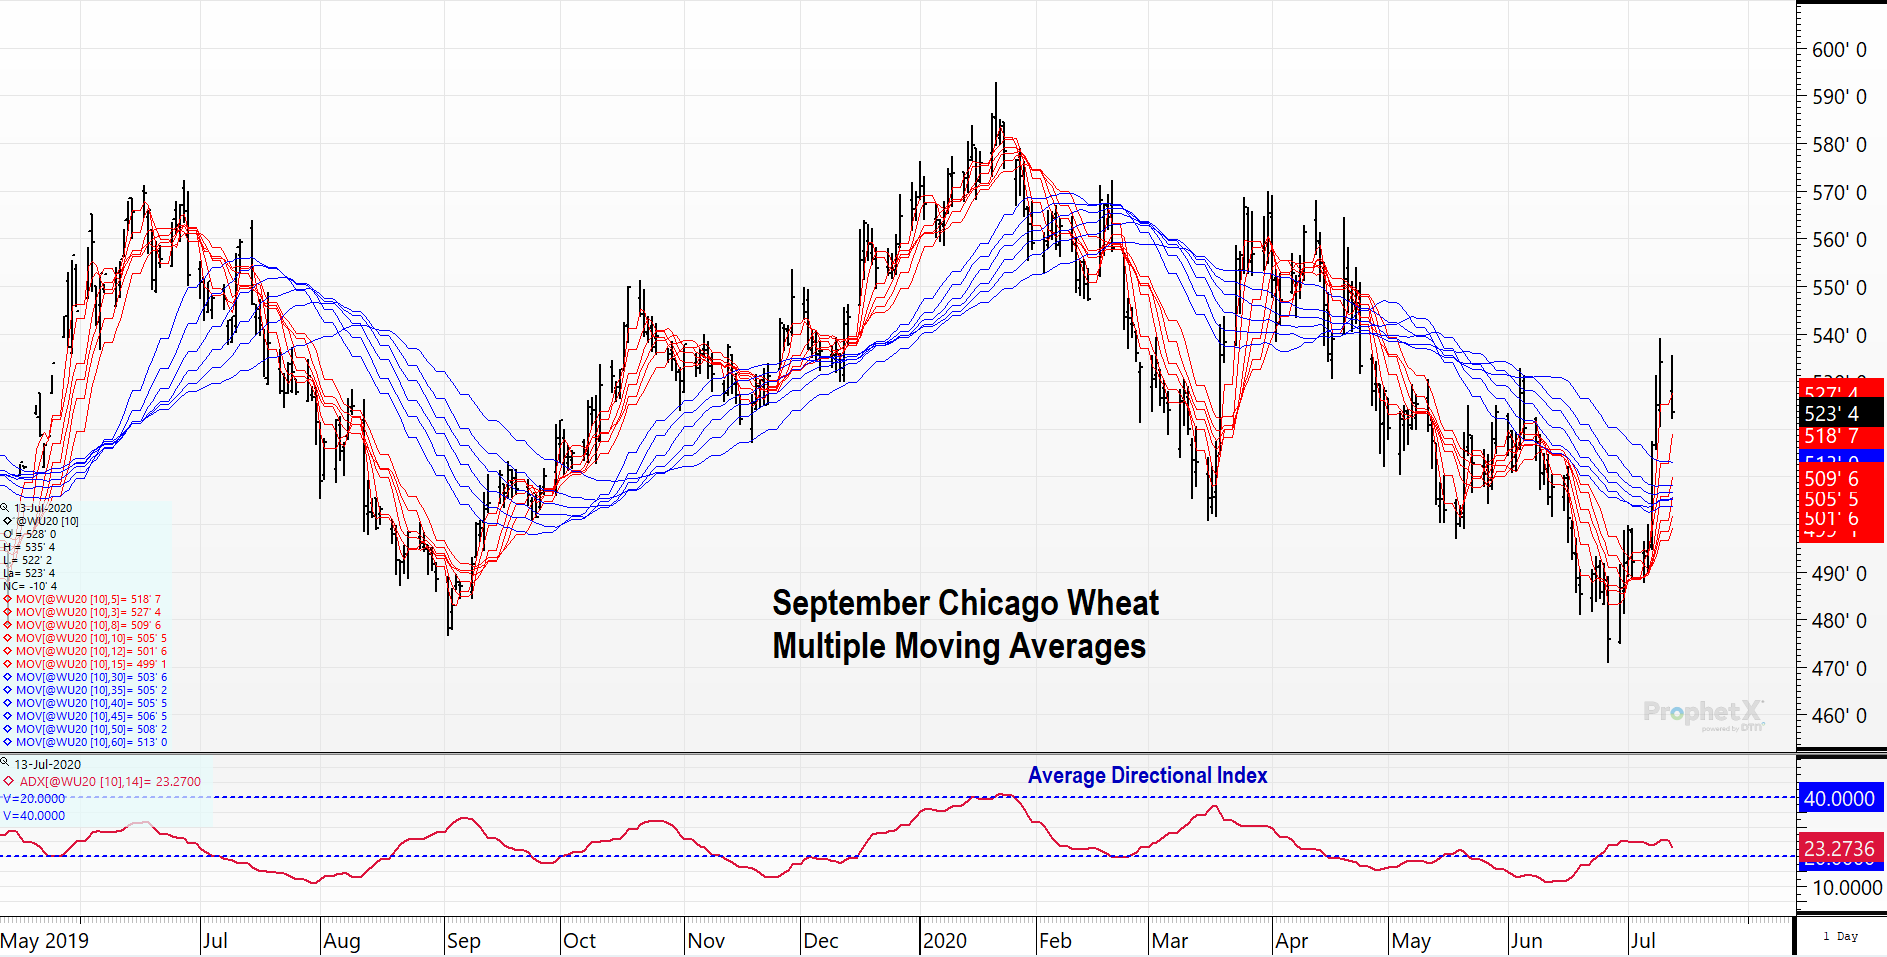
Looking at the mulitple moving averages chart, we can see that prices accelerated through all moving averages (a bullish sign). Slopes of MA’s have turned higher. Price pullbacks into the the longer term moving averages should be seen as buying opportunities. The average directional index has moved above the “20” threshold after lurking below. This is often an indicator that a new trend is beginning, which is supportive of our outlook.
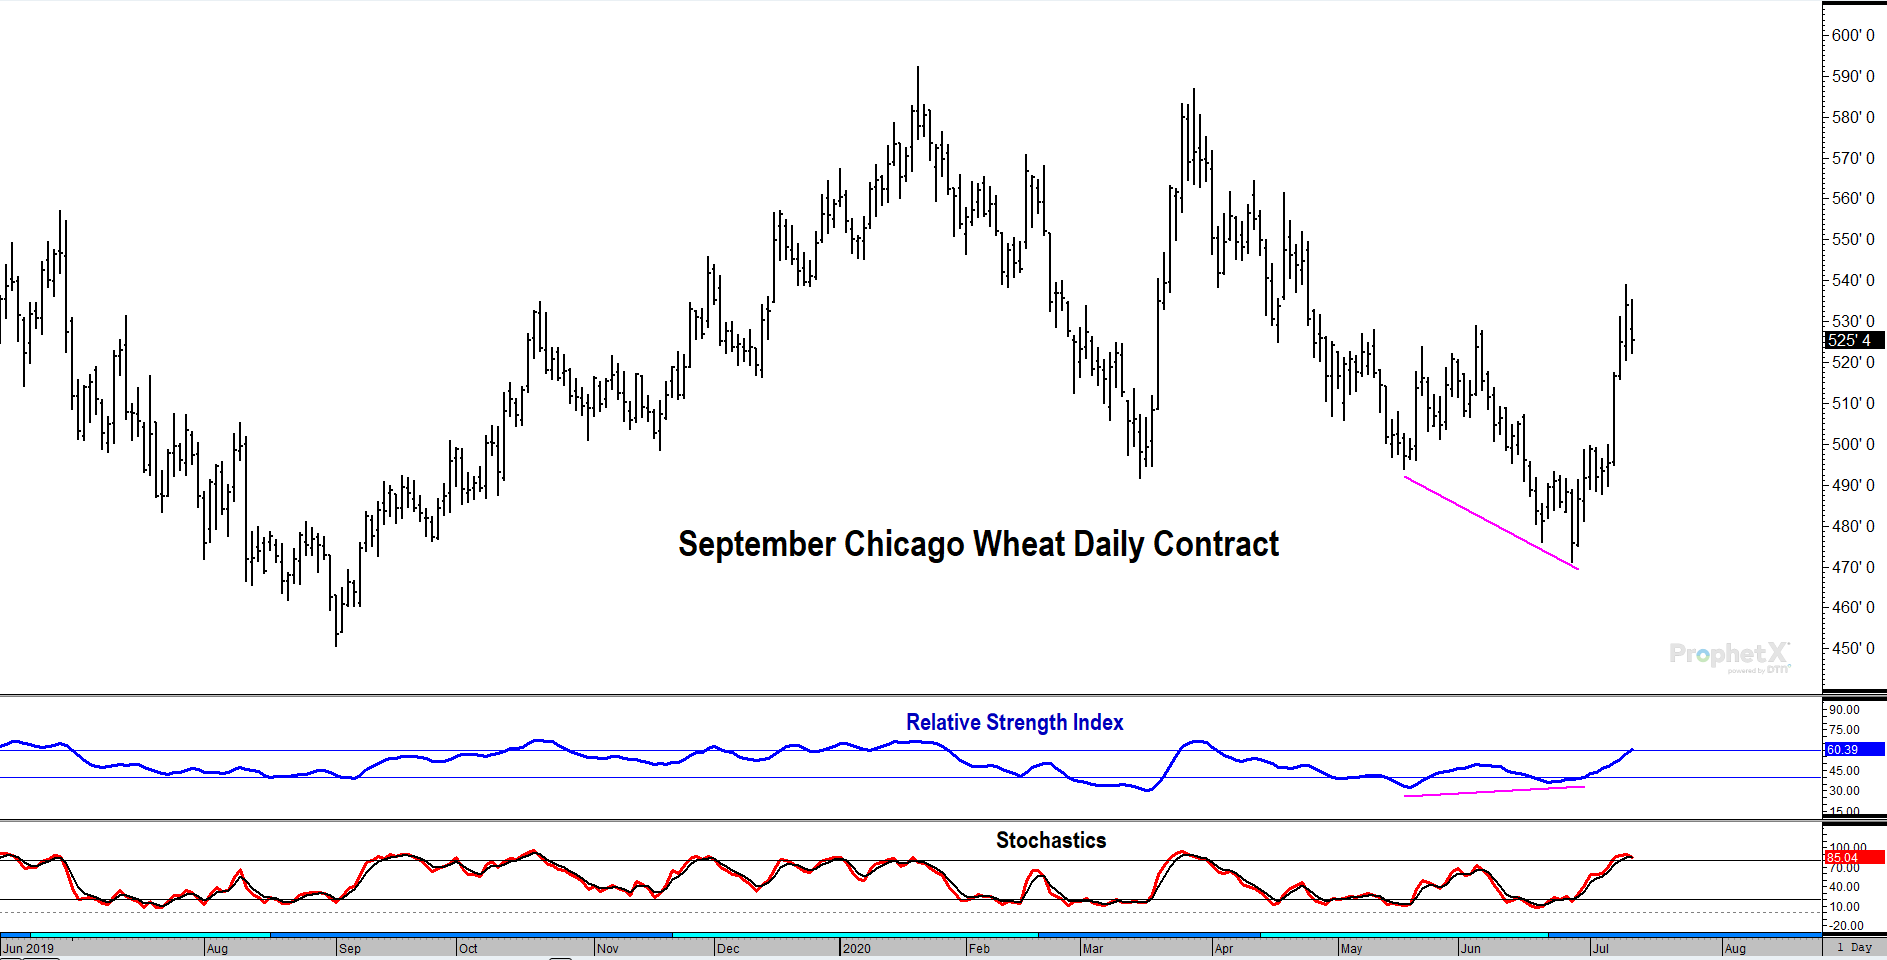
The RSI and Stochastic indicators also exhibited divergence with price in the last decline, a bullish sign.
What does this mean for the wheat buyer?
If you are short, cover now because overall trend has switched to higher. Waiting to pick the bottom is not worth it. If you have sufficient coverage, you can be patient and take advantage of the wave iv dip this week and look to layer coverage in the 5.05-5.15 range.
