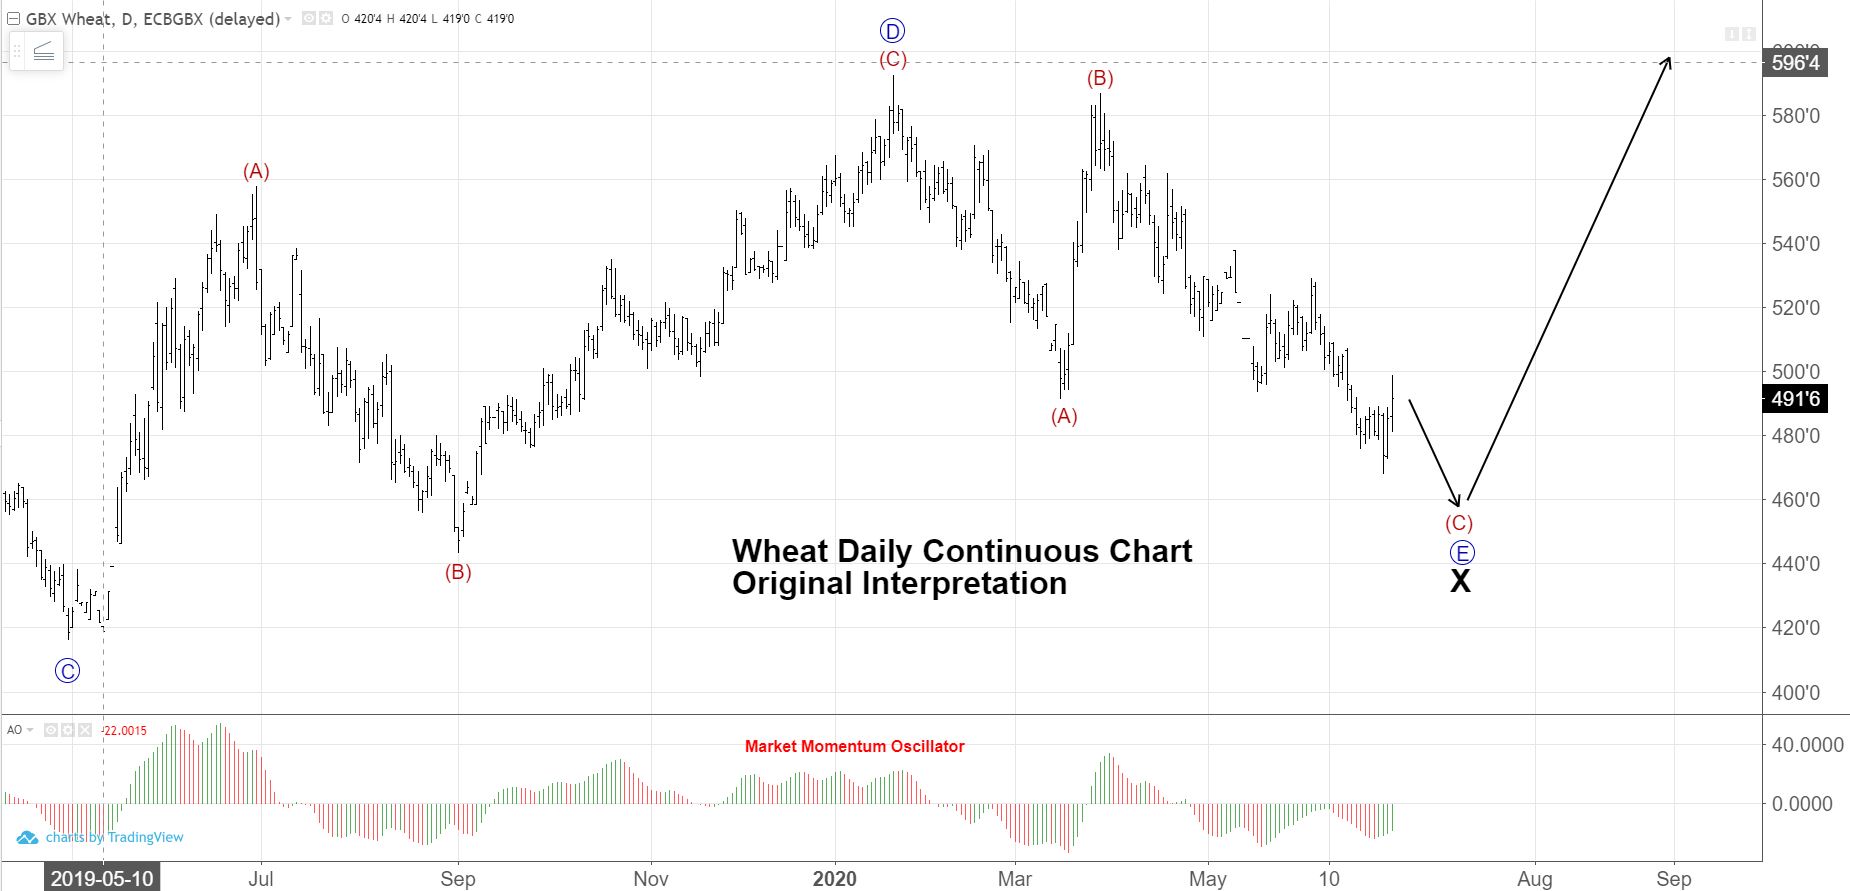
Wheat buyers should be on alert. Although we are still in a downtrend and expectations are for lower prices, the downside targets are small in length in comparison to upside targets once wave (C) of E of X is complete. Tuesday’s USDA Grain Stocks report caused a spike in prices. However, we feel the most probable path is to carve out one more new low before putting in the bottom for the year and for some time in the future.
The daily chart below exhibits bullish divergence in price and momentum—a precursor to a reversal.
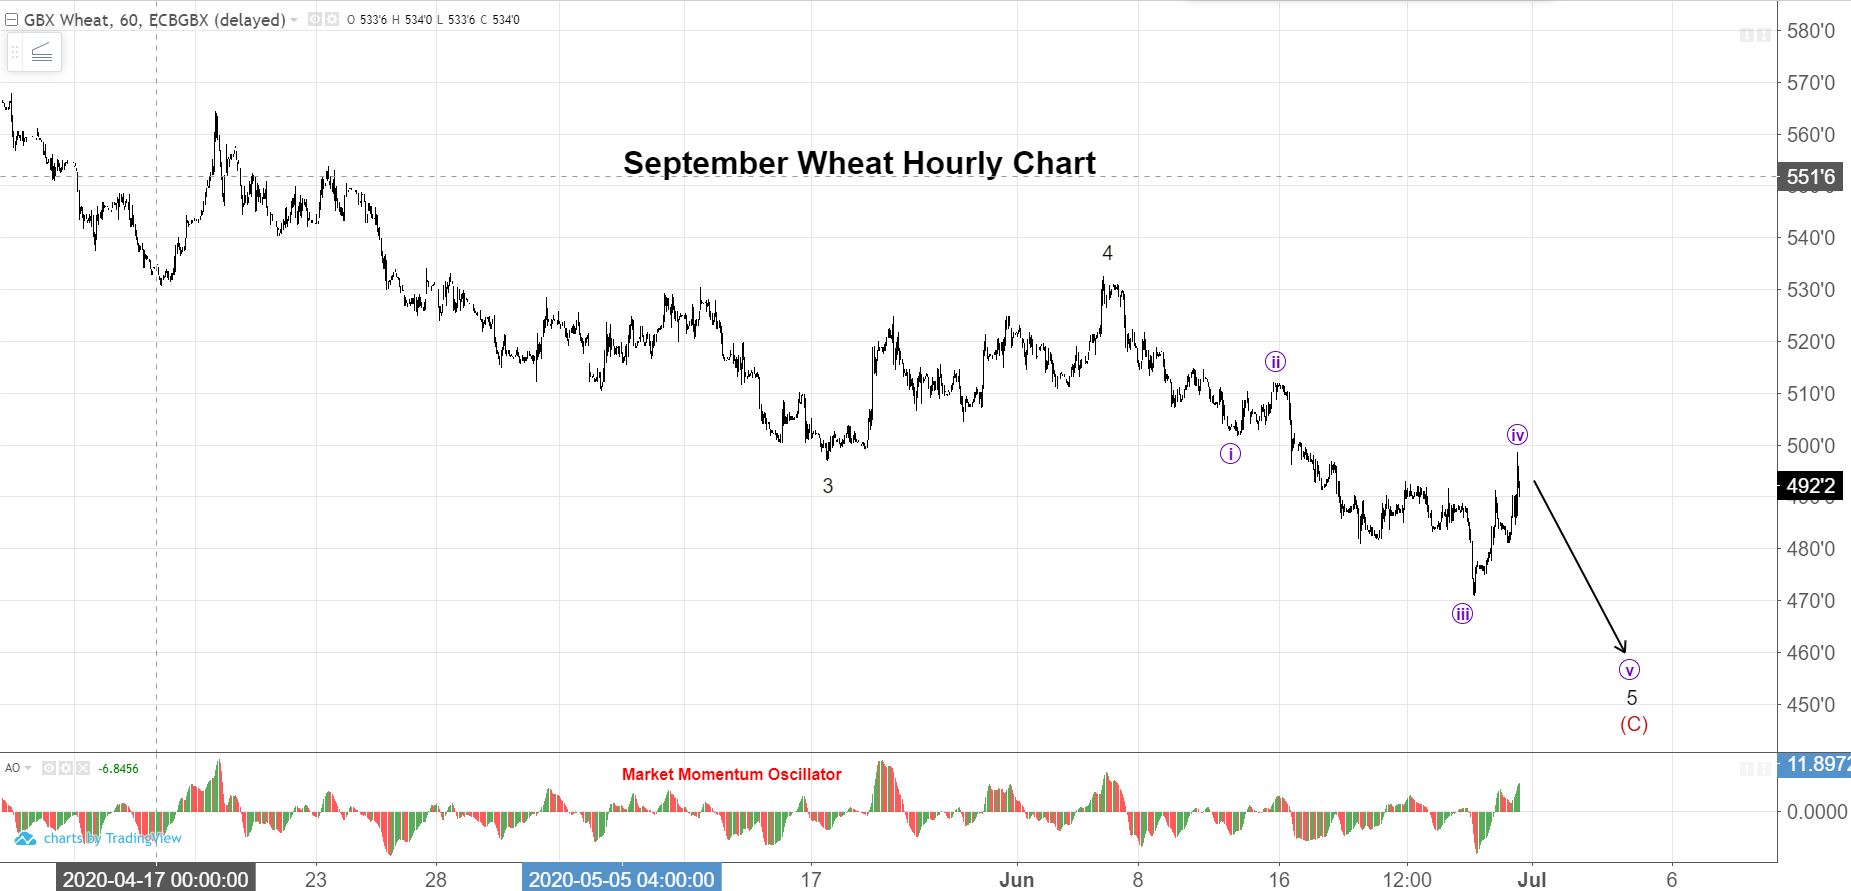
The hourly chart illustrates our primary wave count’s subdivisions.
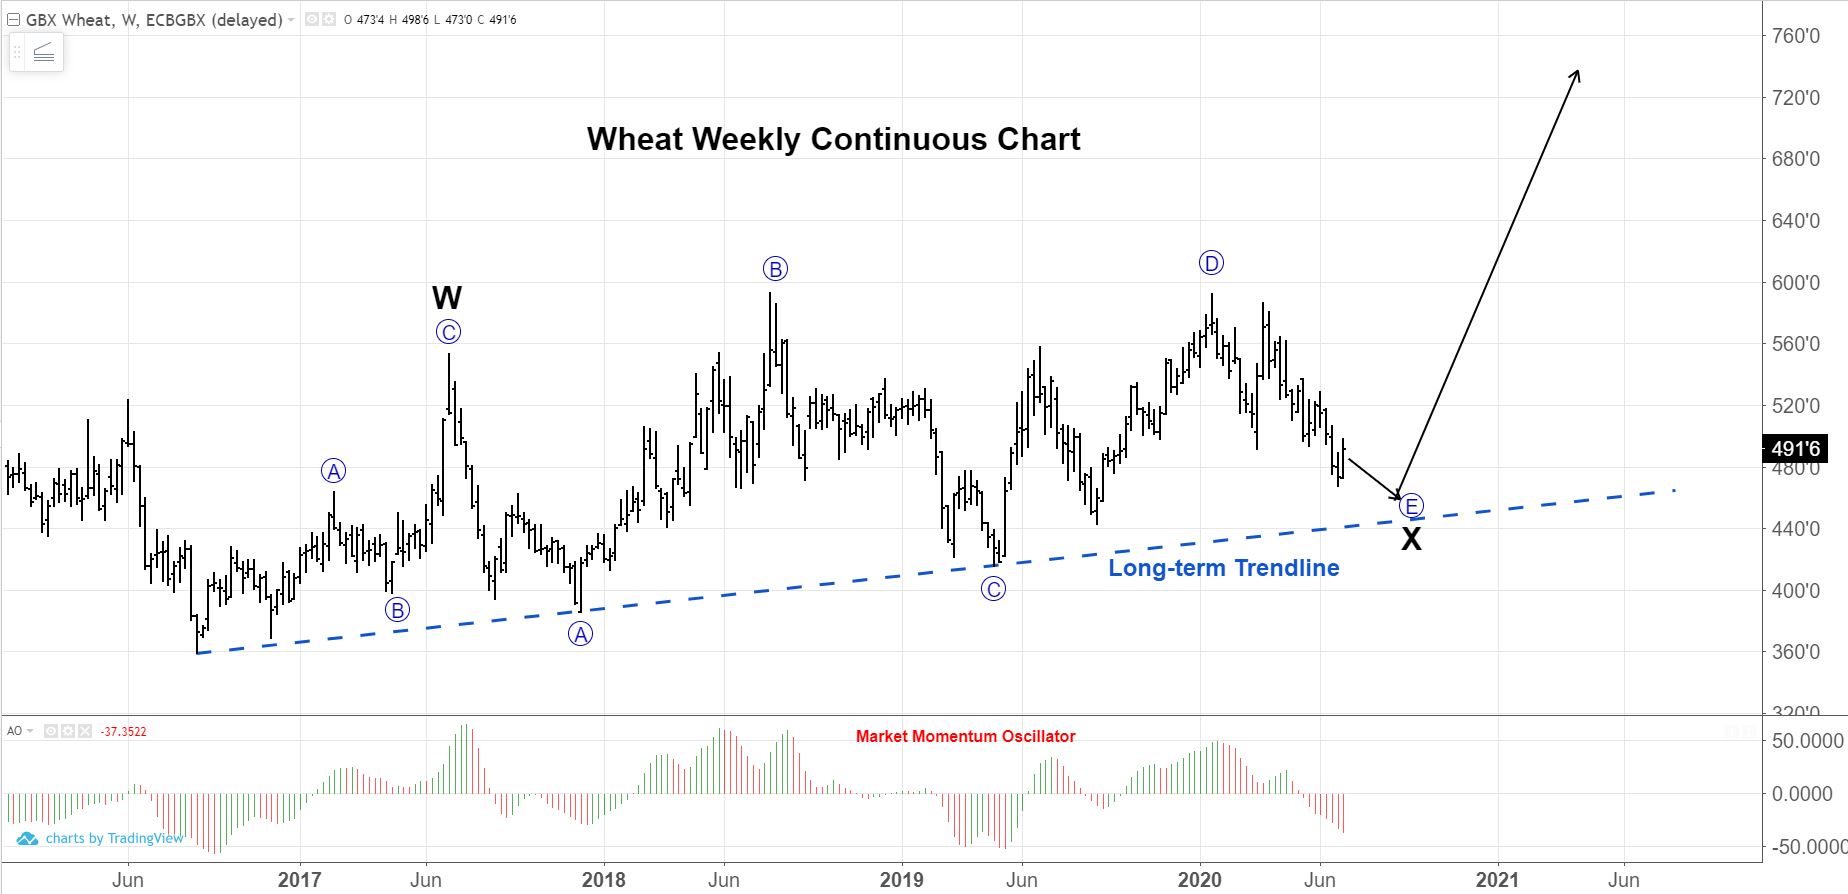
The weekly chart illustrates a well-established long-term trendline, along with the eventual upside target of +$7.00.
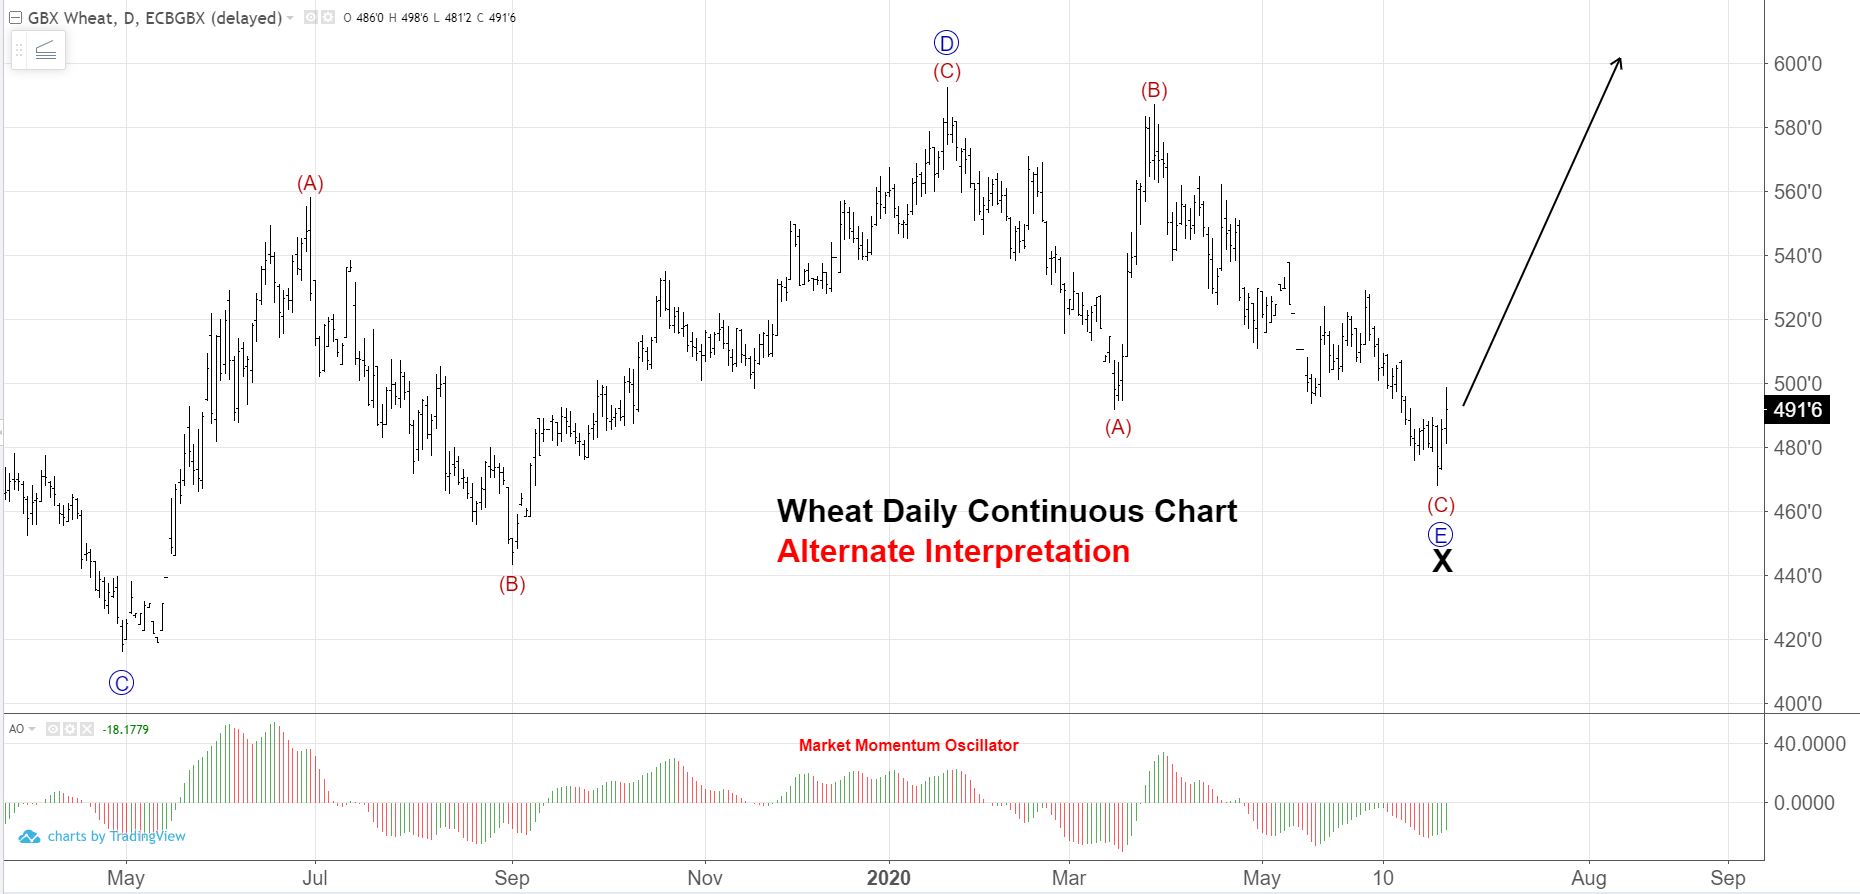
Below is an alternate wave count that is valid. It suggests the bottom of the move is in place and we are only going to rally from here. Although all the pieces are in place for a bottom to be formed, we feel that there will be one more new low.
What does this mean for a wheat buyer?
If you are short, cover now. Waiting to pick the bottom is not worth it. If you have sufficient coverage, you can be patient; however, if prices get above the $5.12-$5.15 level, the probabilities shift towards the Alternate Interpretation and buyers need to be aggressive on pullbacks because the ultimate price target is much higher than current levels.
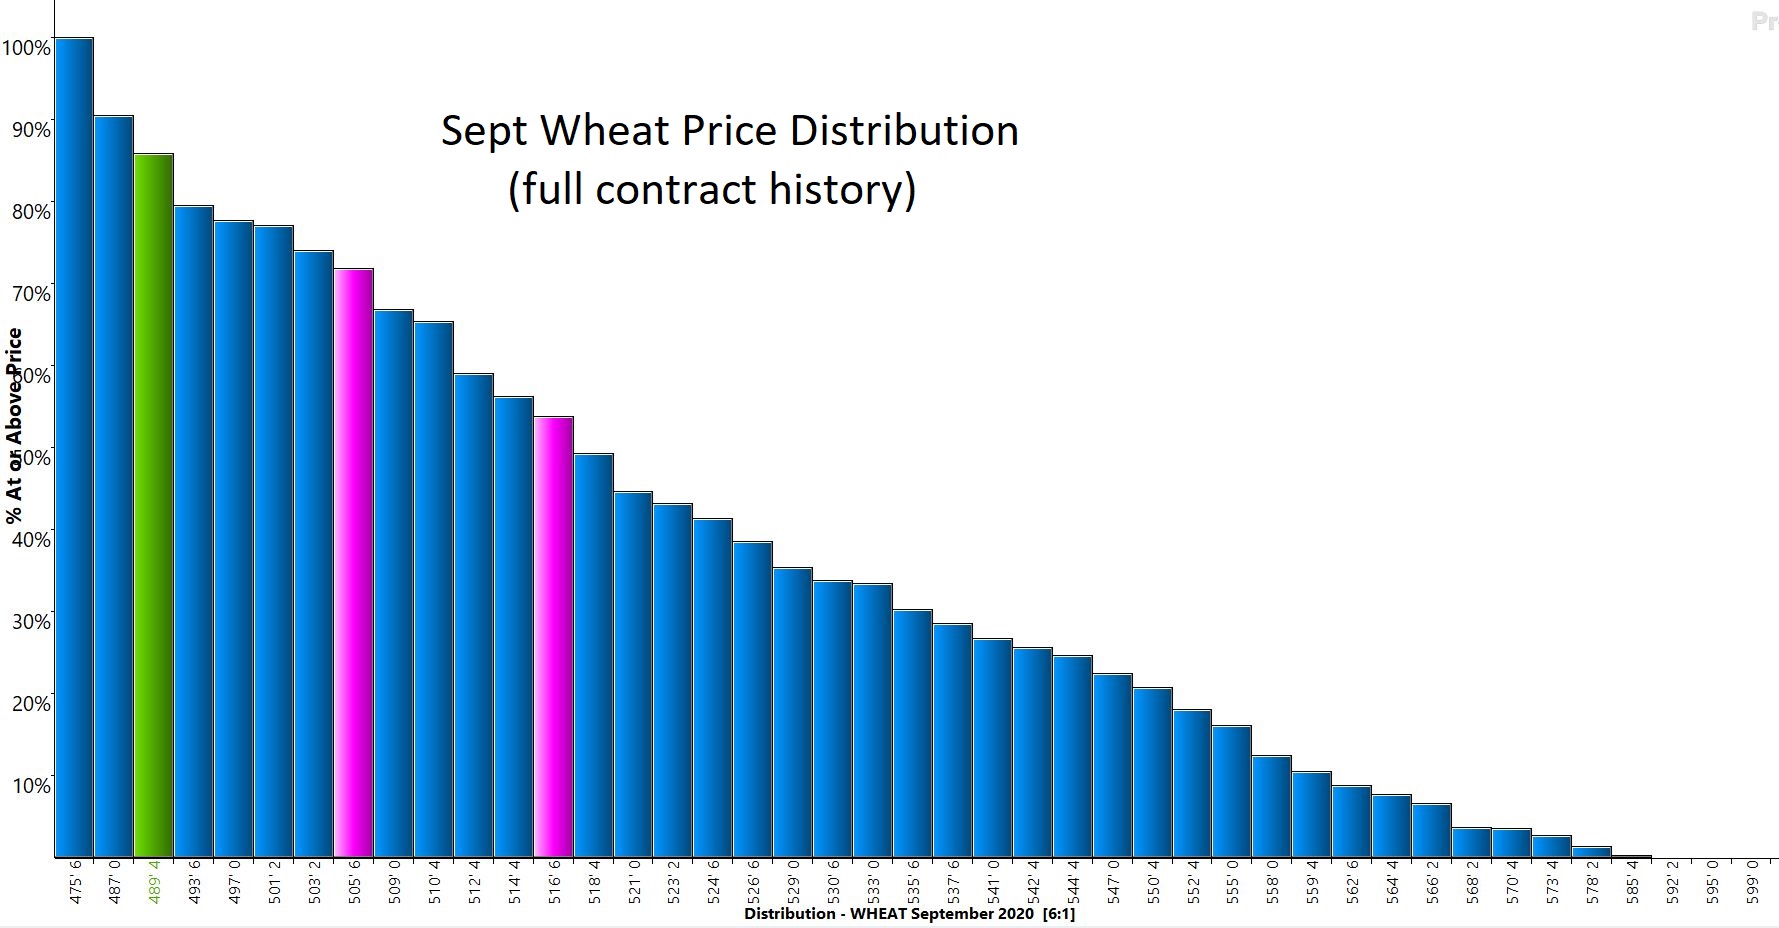
The price distribution below is for September wheat futures. It illustrates we are in the lower 15% of prices traded for the life of the contract. This should give any buyer confidence in pulling the trigger, knowing the value today is much better than we have seen before.
