This post is a follow up from our October 23rd post, December Soybean Oil Futures
If you are an edible oil buyer and do not have sufficient coverage, there are many reasons to be concerned. The fundamentals of this market (which are bullish) can be seen at the end of this post.
Below, we will give an update to our technical outlook on the soybean oil futures. This also paints a bullish picture. Edible oil buyers should be vigilant in taking price pullbacks as opportunities to extend coverage.
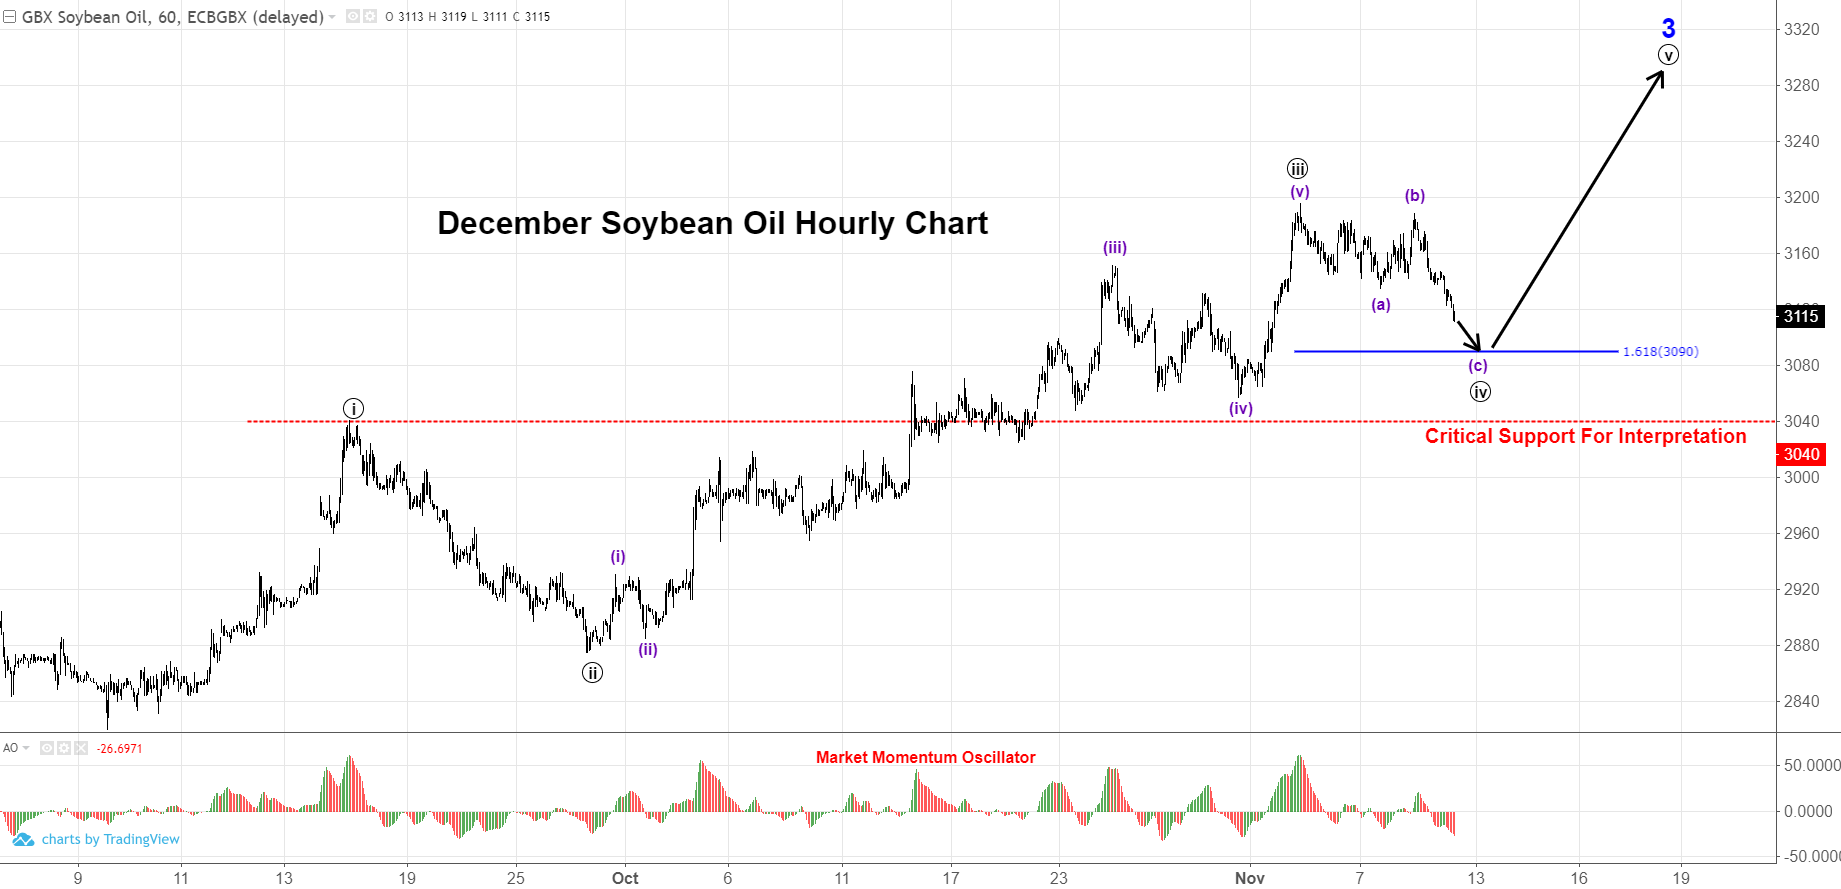
- A price projection in the immediate using the most probable wave count on hourly chart
- Prices adhered to typical Fibonacci targets from previous forecasts. Consequently, this increases the probability that the current wave count is correct one, and adds confidence to future forecasts.
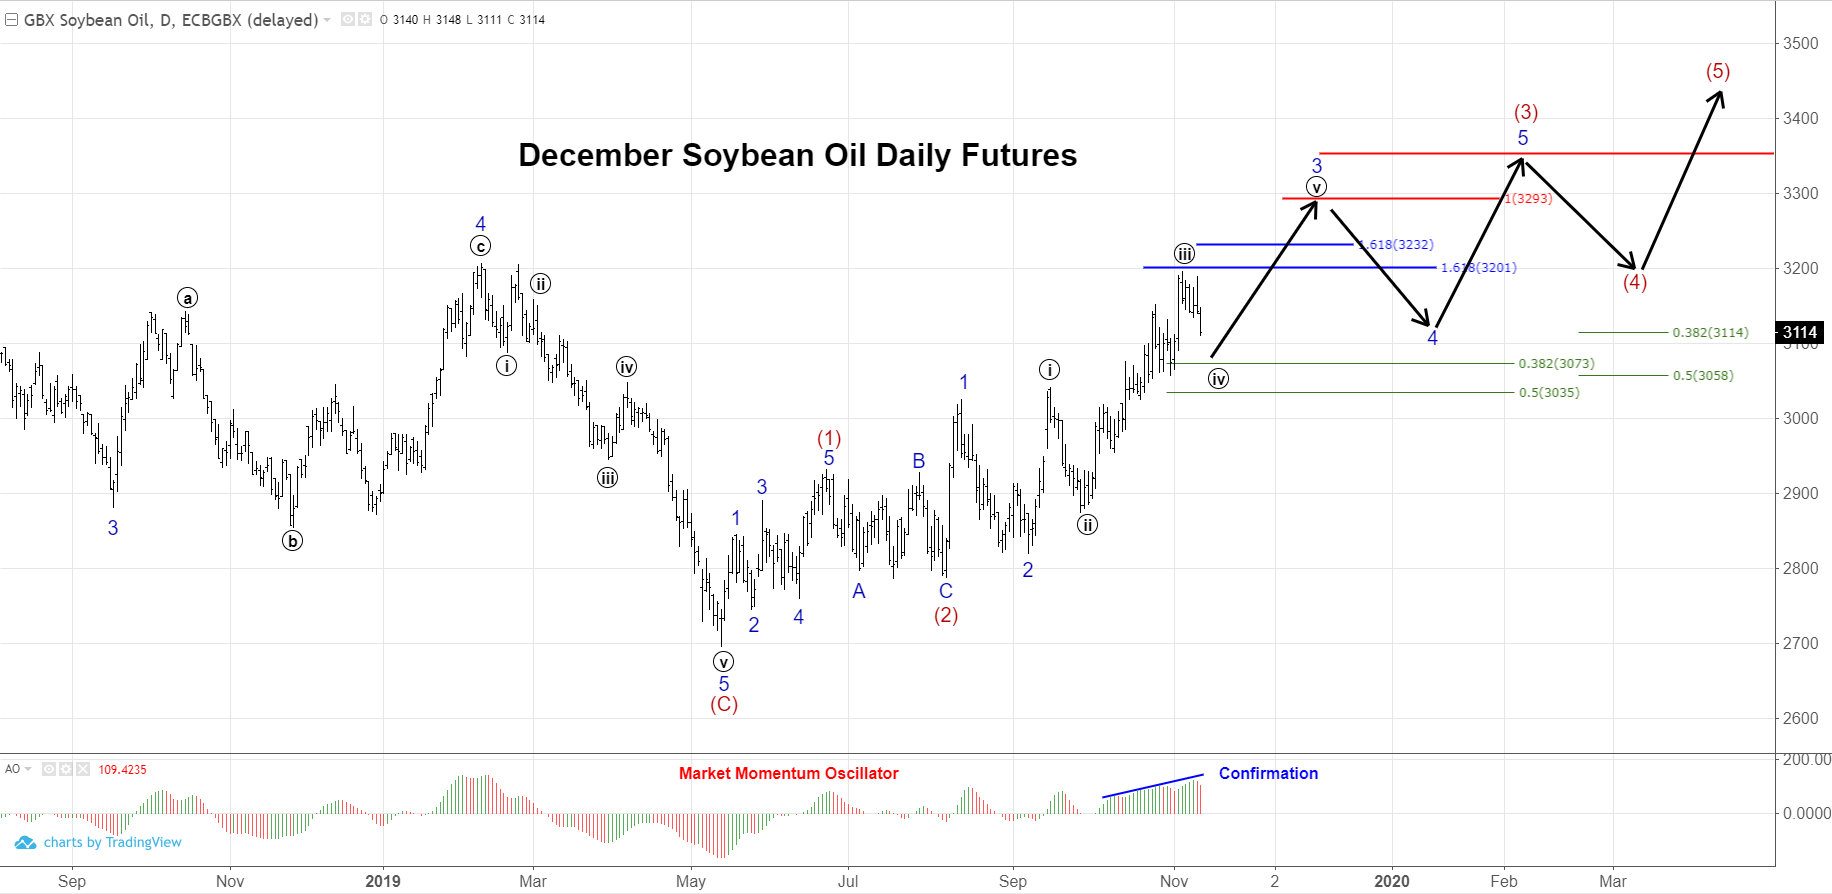
- Price projection using the most probable wave count on the daily chart
- Recent price highs are accompanied by a supportive momentum signature
- Critical Support for this interpretation is a close below 30.24.
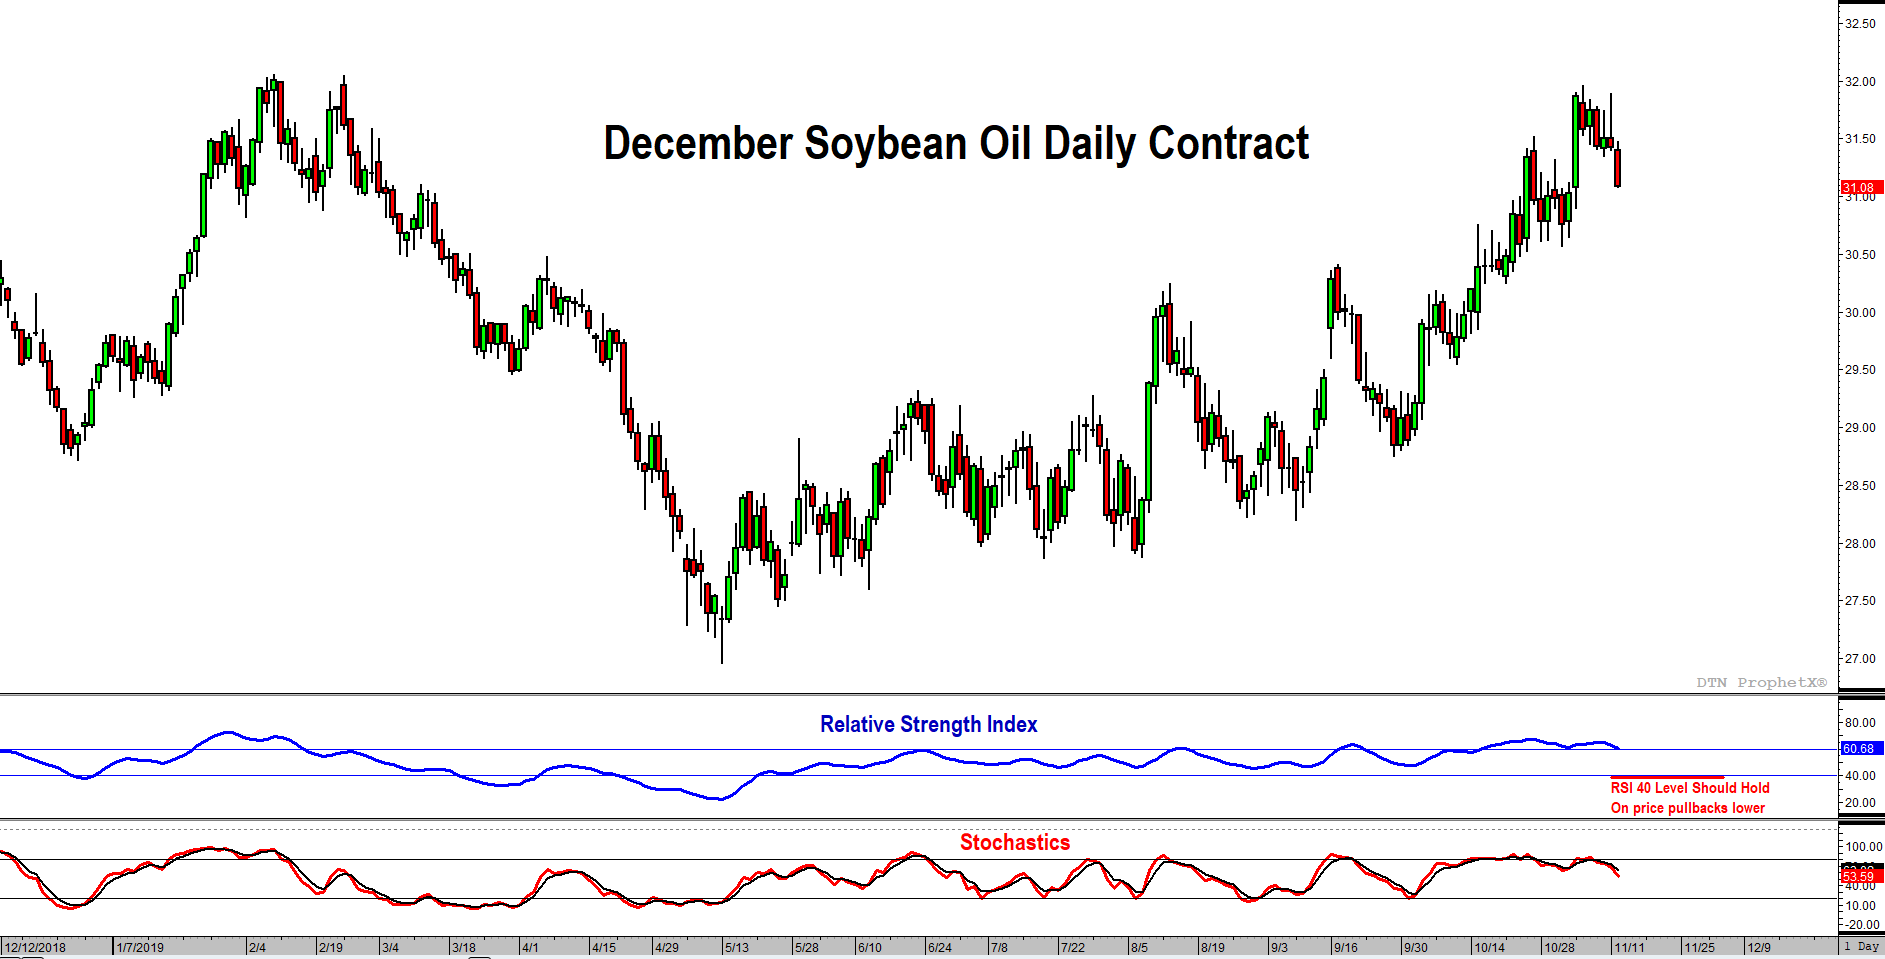
- The Relative Strength Index has established itself above the bear market resistance of 50-60. This implies the previous downtrend (Feb-Jun 2019) is over.
- On pullbacks, which should be viewed as buying opportunities, one can watch RSI for confirmation. Whether the pullback wave degree is minute (iv), minor 4, or intermediate (4), RSI should maintain above the bull market support line of 40.
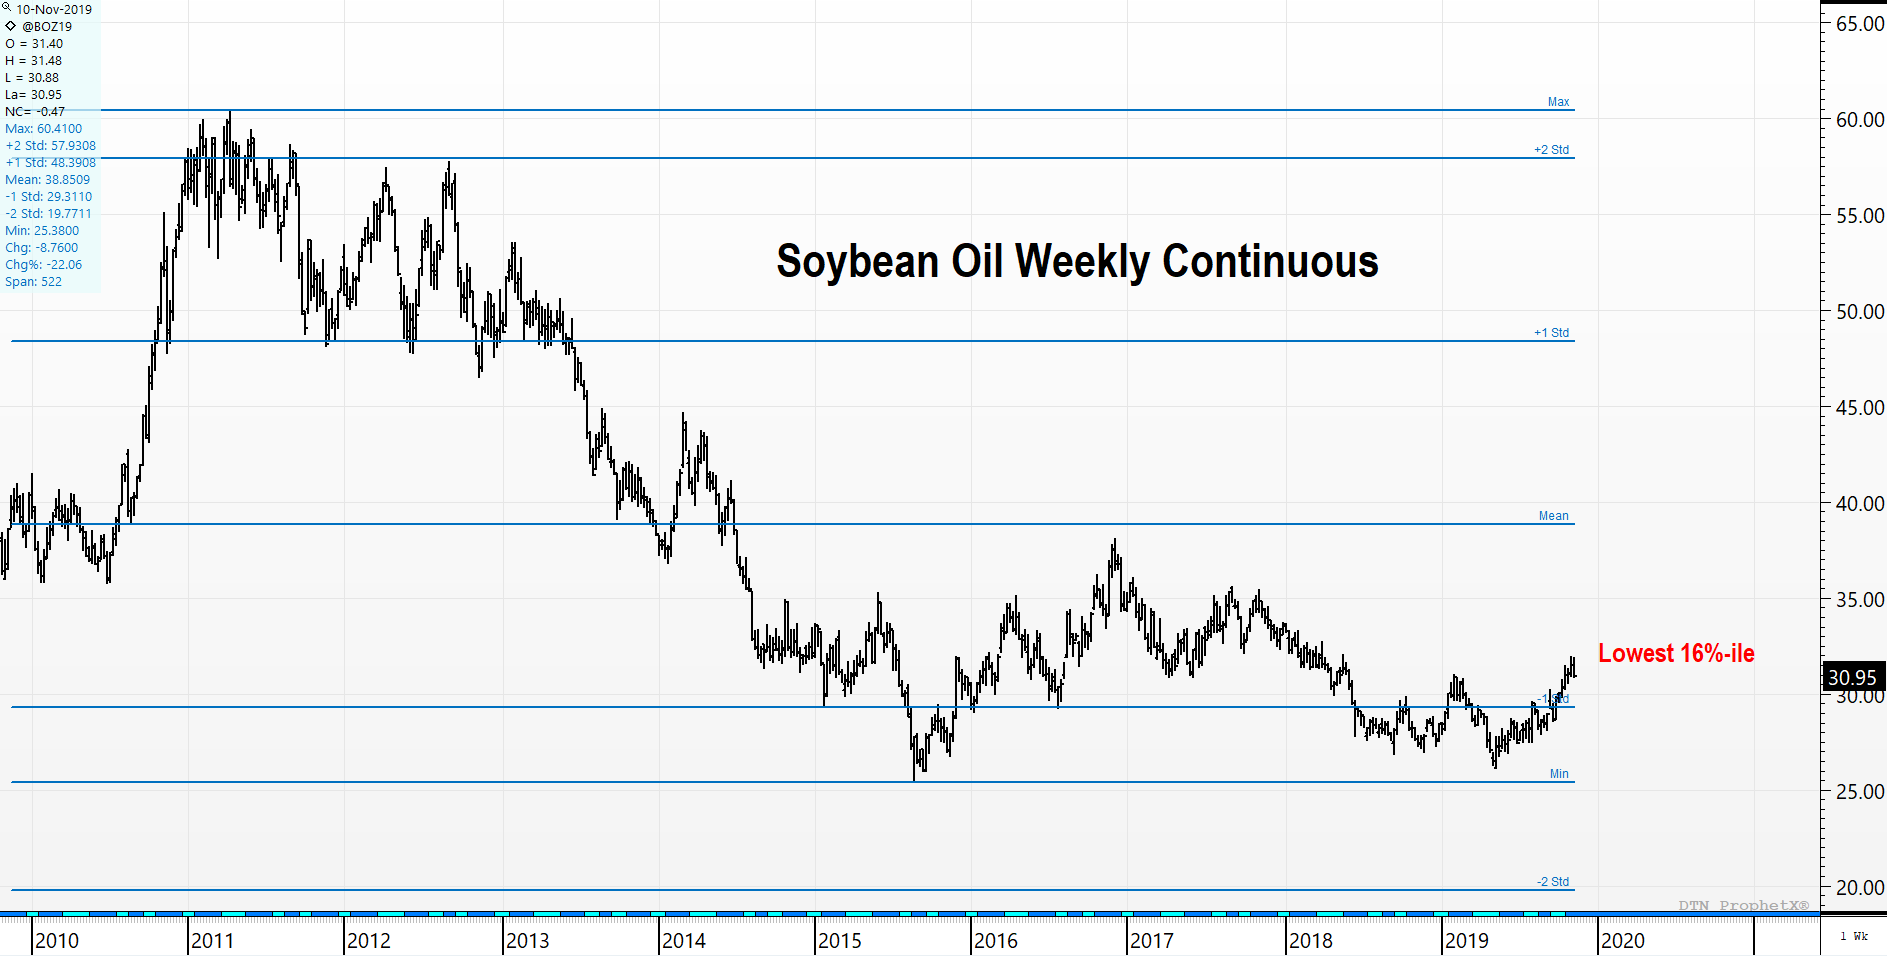
- Taking a long-term view, current prices are in still in the 16th percentile of the last 10 years.
- The mean (average) price for Soybean Oil in this time frame is $0.3885. Thus, returning to the long-term mean poses a substantial risk for buyers of SBO.
Soybean Oil Fundamental Information
- USDA seeing the global vegetable oil balance sheet tightening further. The combined balance sheet for coconut, cottonseed, olive, palm, palm kernel, peanut, rapeseed, soybean and sunflower oil saw ending stocks decline by 572,000 mt from the previous month with ending supplies the lowest since 2009/10. The combined stocks/use ratio fell from 6.69% to 6.51% and is now the tightest since 1976/77.
- The big three vegetable oils of palm, rapeseed and soybean saw their combined ending stocks fall to 14.7 million metric tons mmt), the smallest since 2009/10 with the stocks/use also the tightest since the 1970s.
- Growing world biofuel demand and slower crush rates, are driving veg oil markets.
- Accentuating the bullishness, the combined global balance sheet of soybean oil, rapeseed oil and palm oil will see the largest combined production on record at 160.6 million metric tons (mmt) but the smallest ending stocks since 2010/11.
- Top palm oil industry analysts on Nov 1 revised up their price outlook for palm, pointing to reduced production and Indonesia’s B30 bio-diesel program. Dorab Mistry said the palm market started rallying after Indonesia released its biodiesel allocation decree. Since then, sentiment had been “red hot,” Mistry said, as he revise up his price outlook for Malaysian palm oil to 2,700 ringgit ($648.57) per tonne in March 2020, from an earlier estimate of 2,500 ringgit per tonne. [Palm closed at 2461 when he made comment, now at 2627.]
- Palm prices seen rising further as output falls, exports jump. Heavy buying by importers as production likely to fall in 2020. October’s Malaysian output was down 2.5% versus the previous month, while exports were up 16.4%.
- US SBO stocks continue to drop y/y; now at lowest level since November 2017.
- Edible oil bulls citing:
- Increasing bio-diesel mandates in Brazil/Asia
- Concern that dry pattern undermining Australian wheat production will negatively impact Indonesia/Malaysia palm oil production
- WASDE forecasting 185 mil lb drop in 10/20 US soy oil stocks vs. LY and a 1.74 cent/lb gain in 2019/20 US domestic soy oil price.
- Relatively youthful (less than 2 months) shift in managed funds from short to long position in soy oil. Managed funds have nearly doubled soy oil long in 2 weeks.
- Concern that reduced PRC soy crush triggers increase in China’s edible oil import
- An industrial oil broker contact thinks if we get oil share to 35% +, we will see a heavier bean and canola crush. Now at 34.3%


