Buy your soybean oil
This post is a follow up from our “A Reinforced Case For A Bullish Edible Oil Market” and our “Seasonality in the Corn and Soybean Markets” posts.
Below gives a technical picture of the most probable wave count and why buyers should extend your coverage in Soybean Oil. At the bottom is a summary of the most pertinent fundamental information that helps corroborate what the charts (market) is telling us.
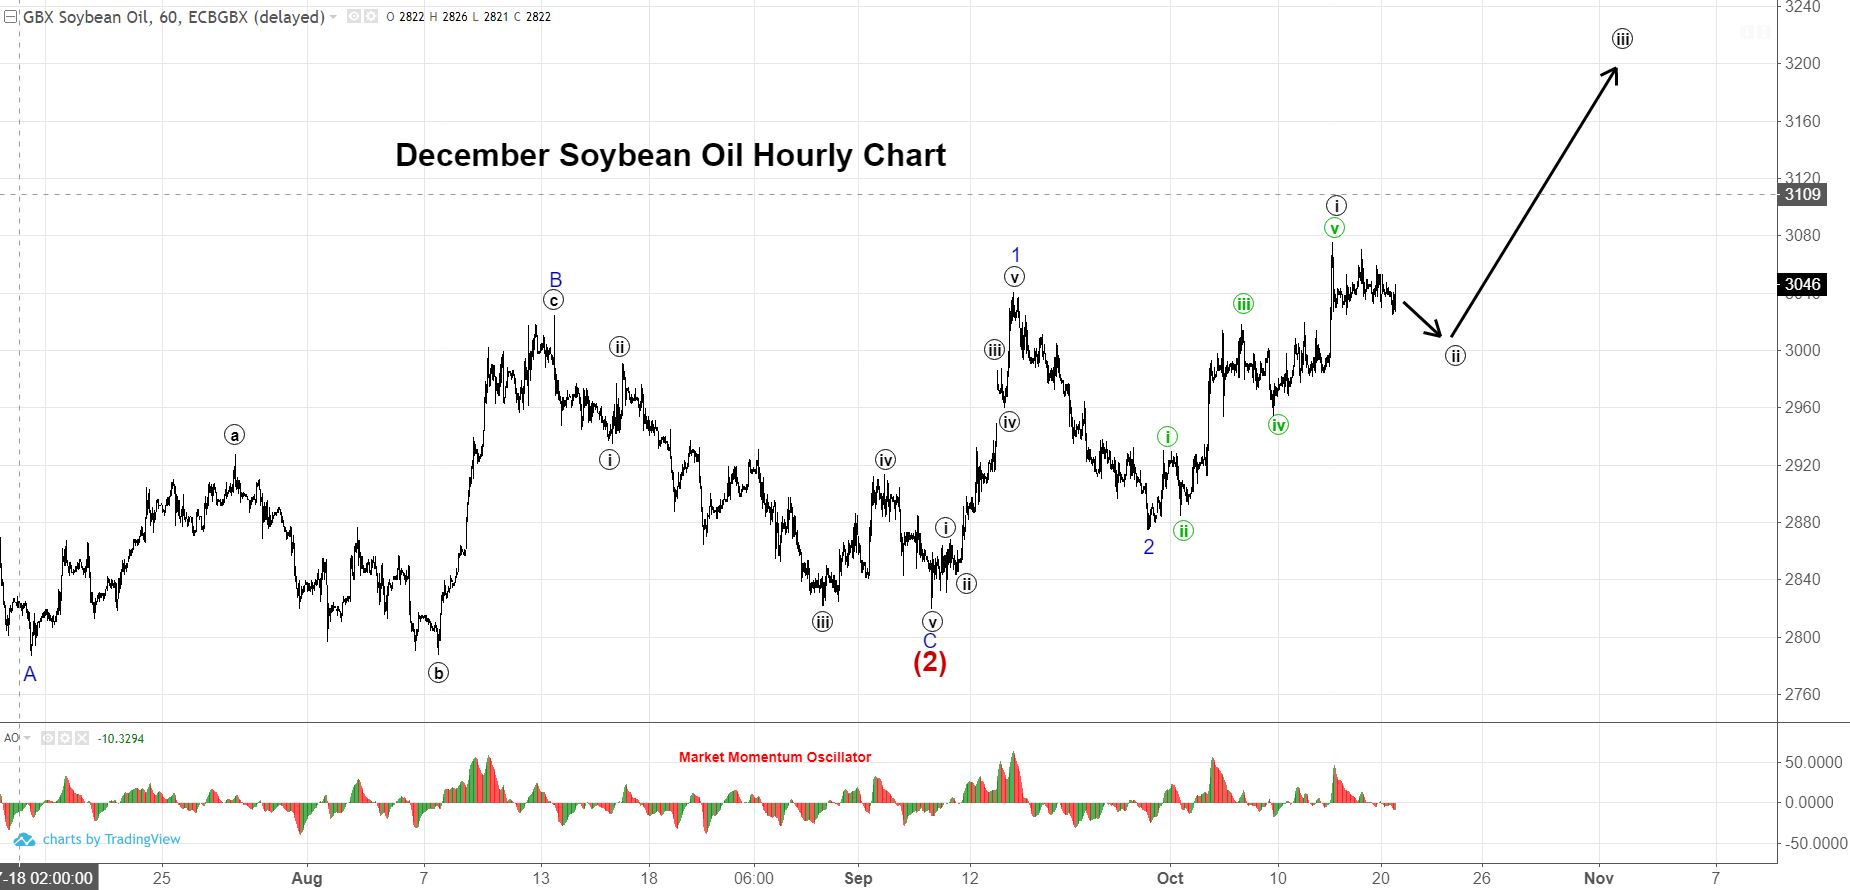
- A projection of prices in the immediate using the most probable wave count on hourly chart
- Critical support for this interpretation is $.2870.
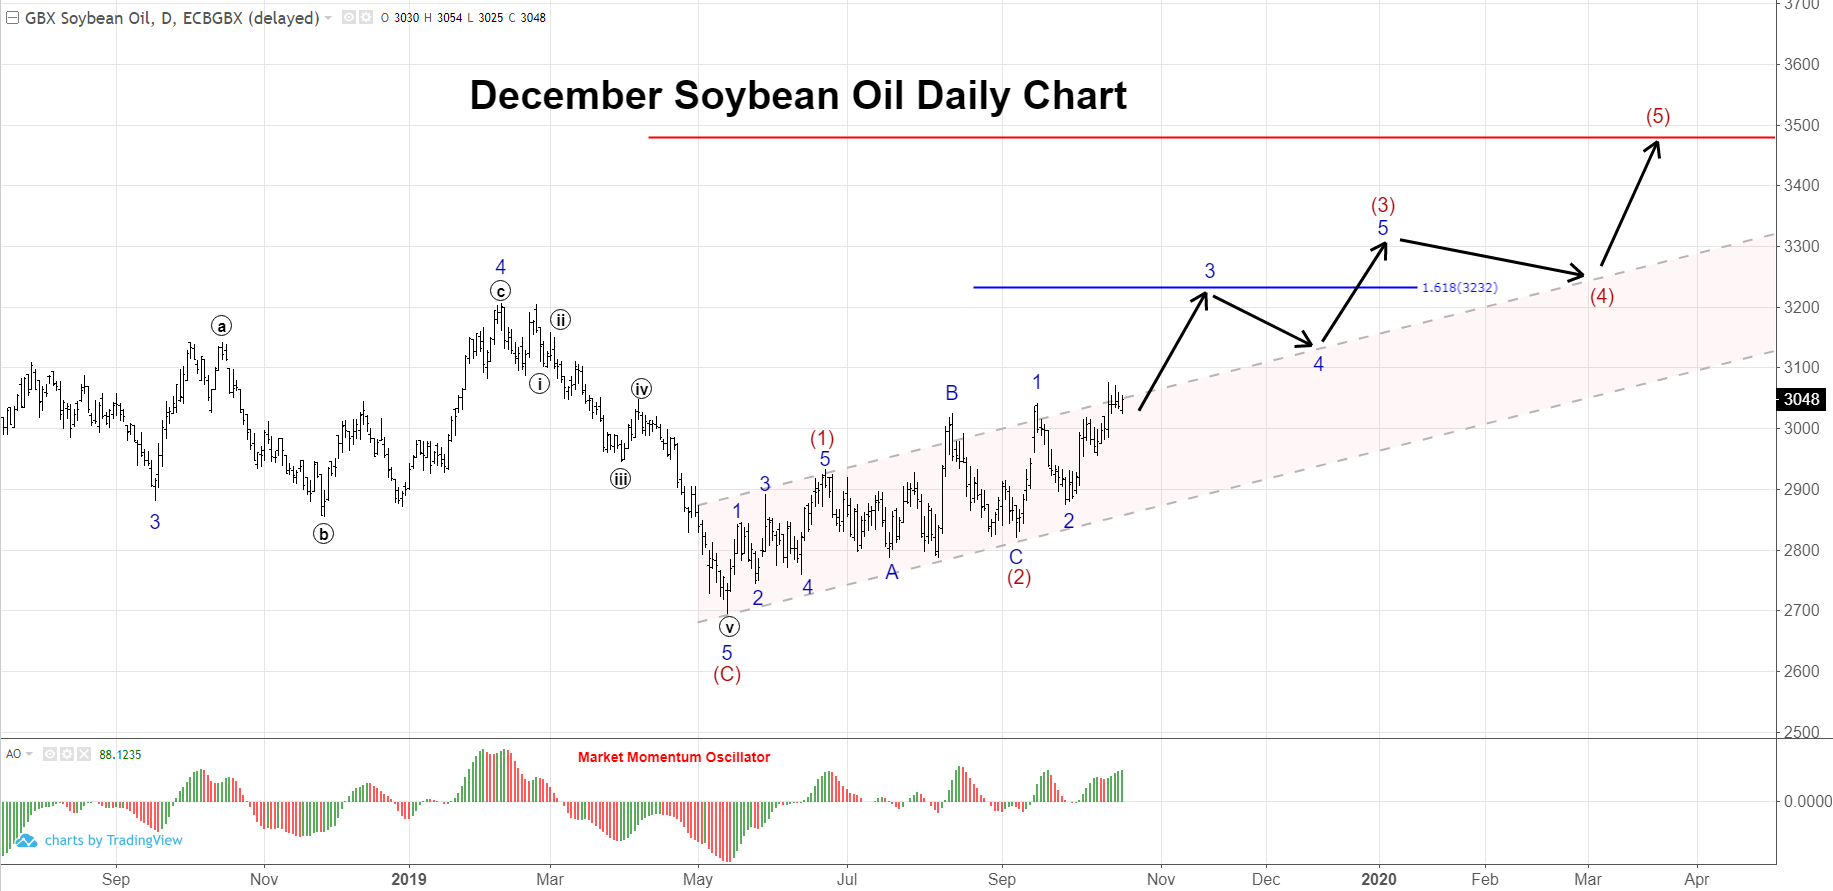
- A projection of prices the using the most probable wave count on the daily chart
- Recent price highs have been accompanied by a supportive momentum signature
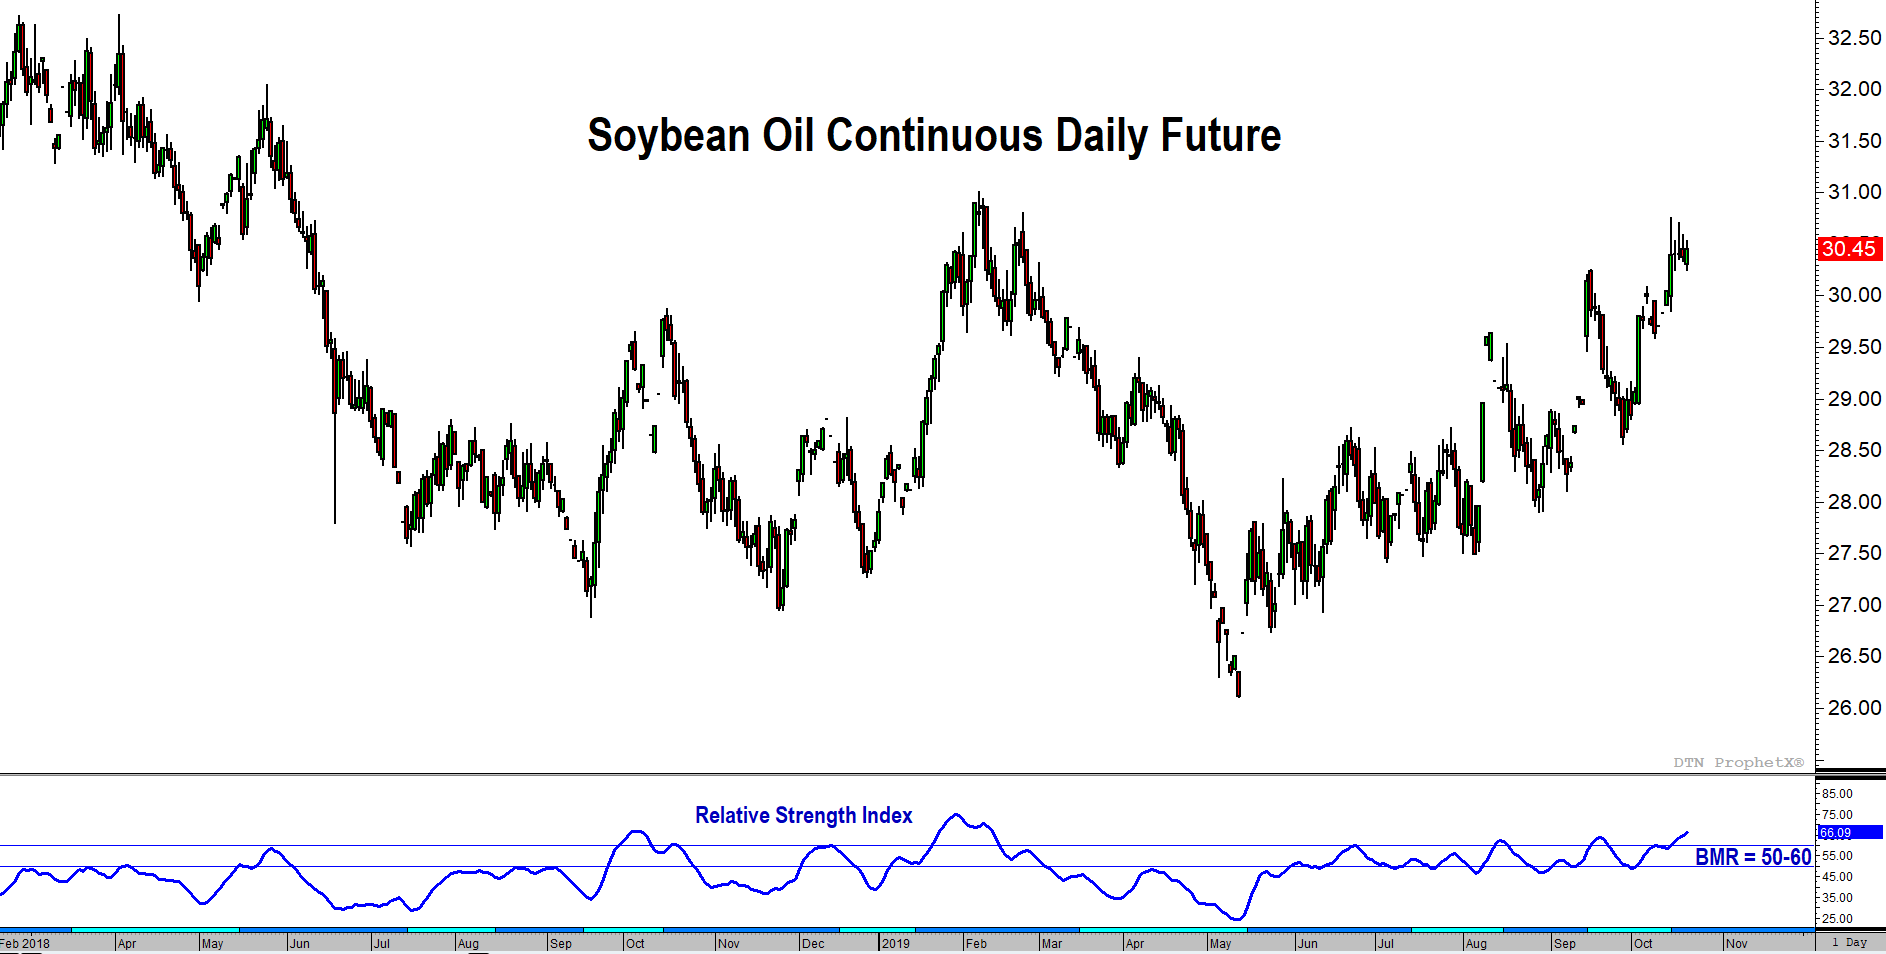
- The Relative Strength Index has established itself above the bear market resistance of 50-60. This implies the previous downtrend (Feb-Jun 2019) is over.
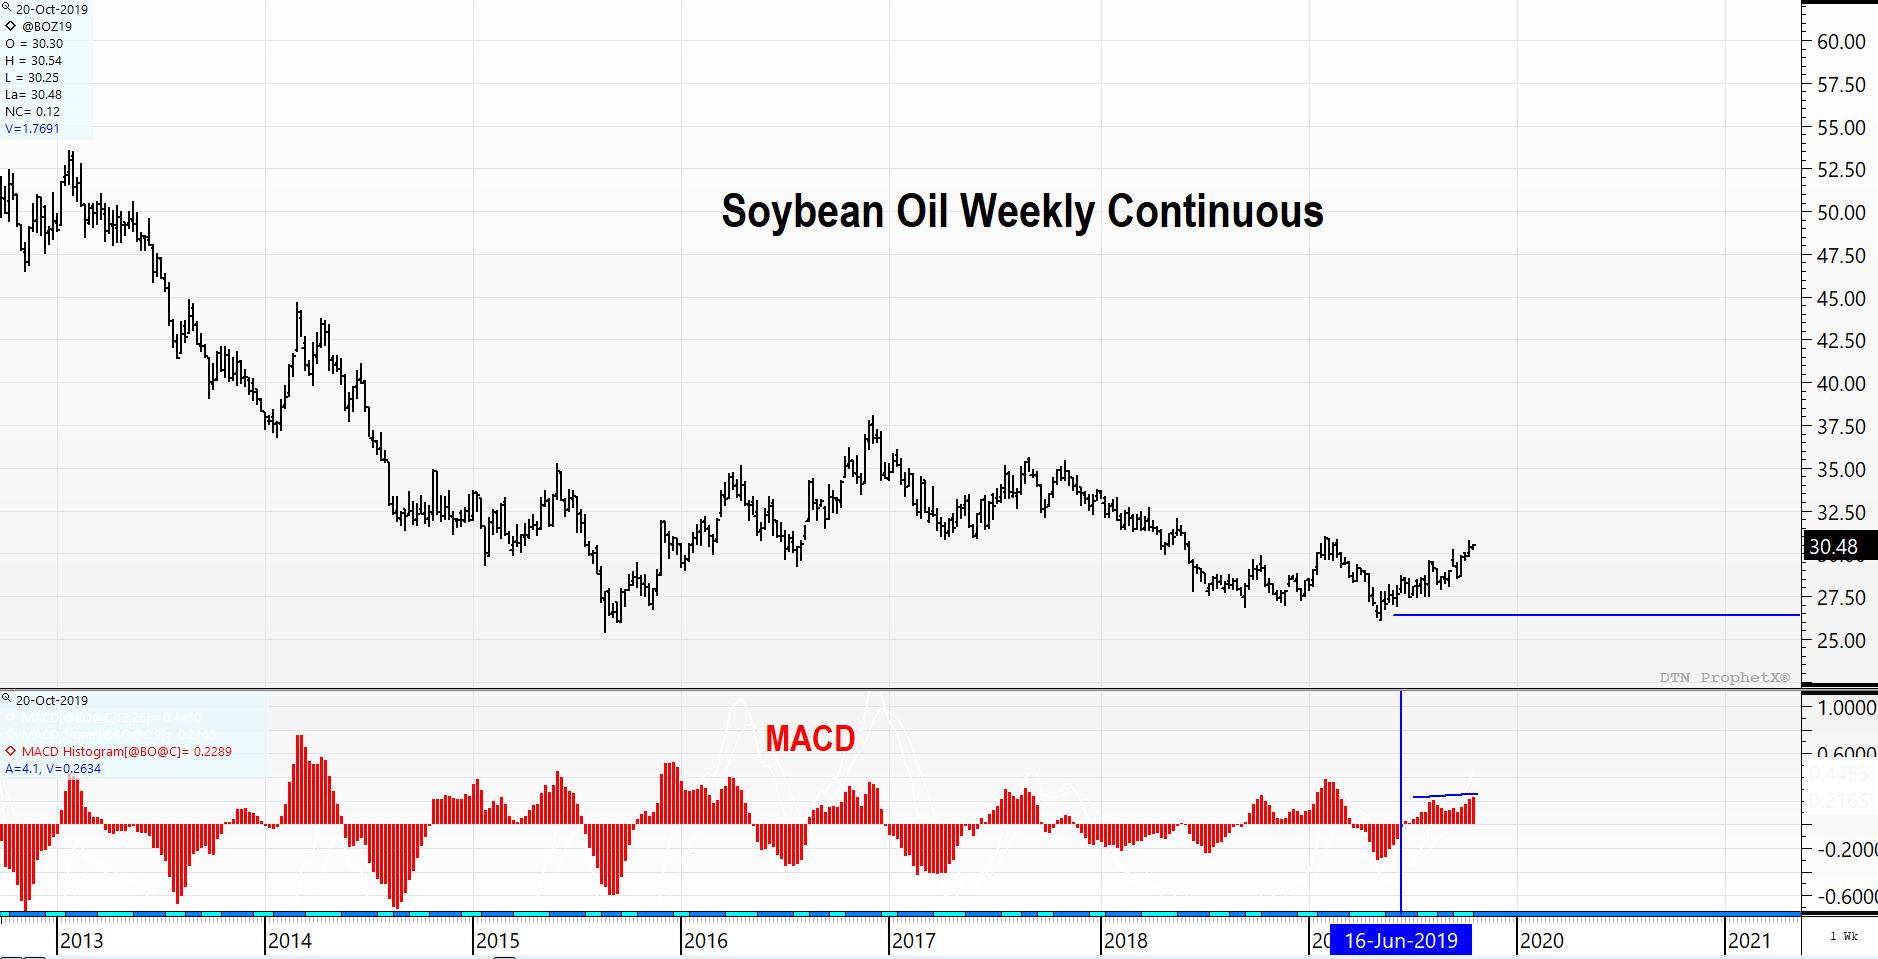
- Since turning positive on the week of the June 16th, the MACD has matched higher highs in price with higher highs in momentum. This suggest we have more upside to go.
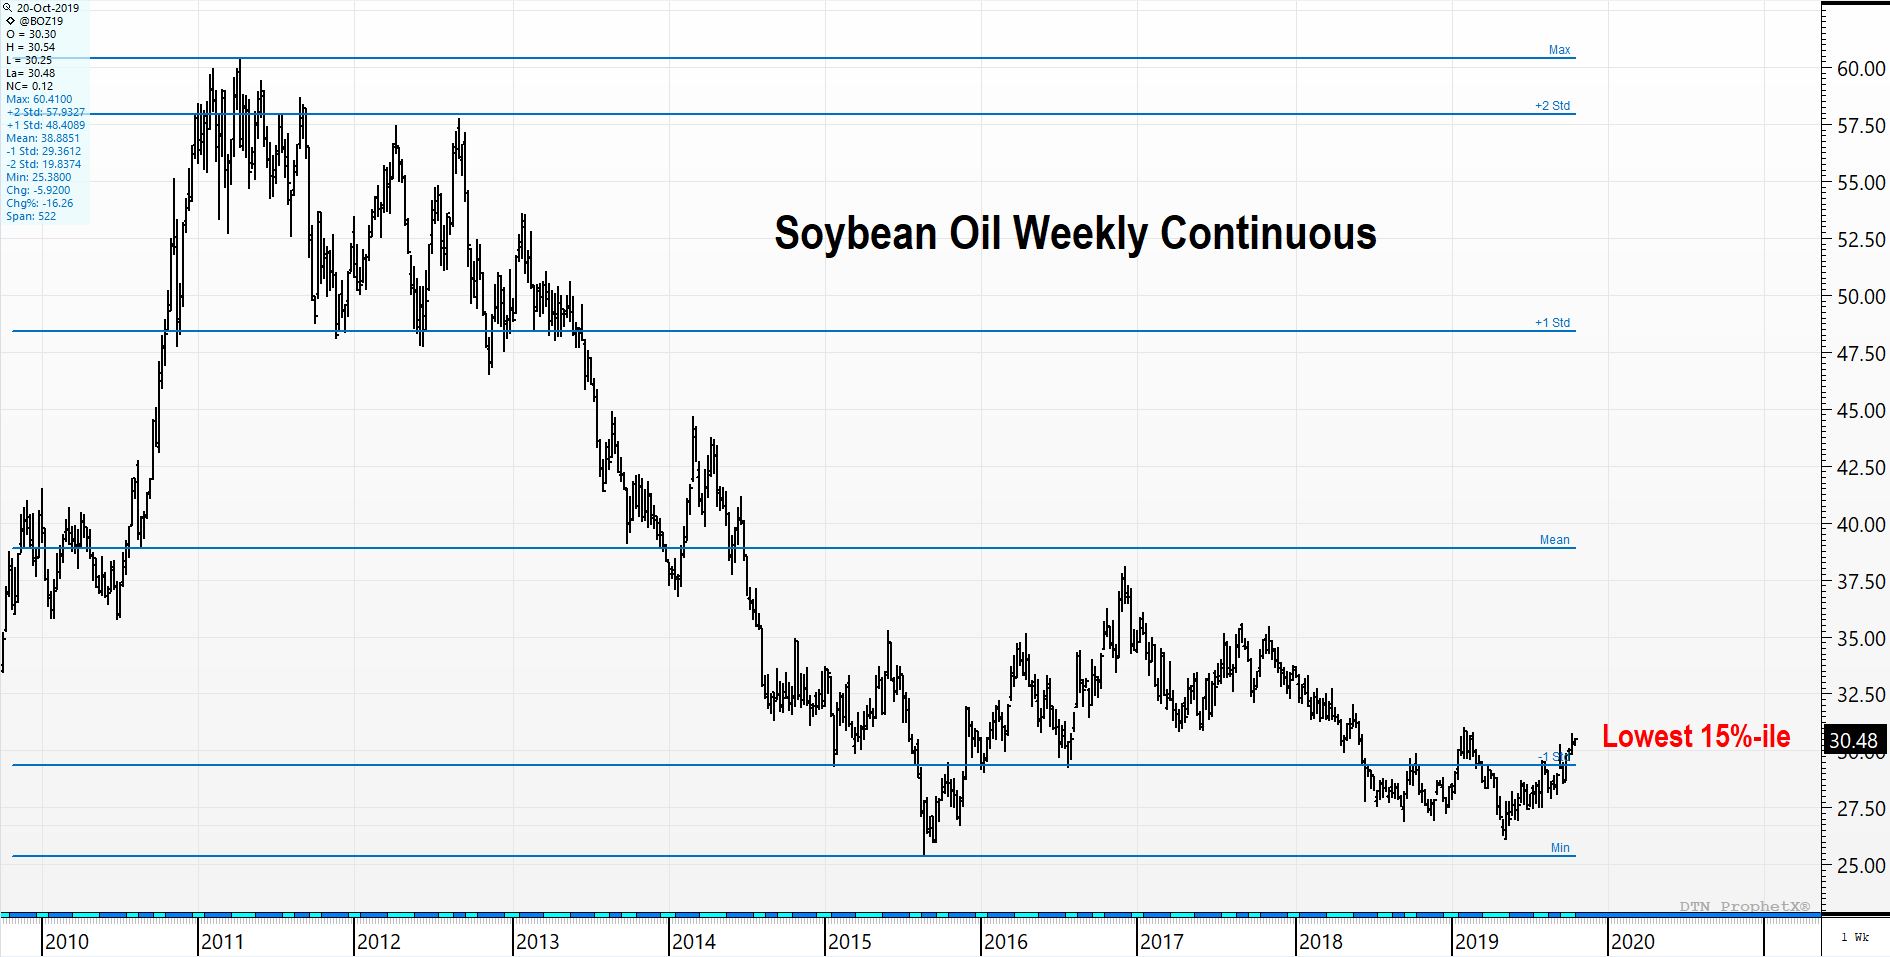
- Taking a long-term view, current prices are in the 15th percentile of the last 10 years.
- The mean (average) price for Soybean Oil in this time frame is $0.3889. Thus, returning to the long-term mean poses a substantial risk for buyers of SBO.
Soybean Oil Fundamental Picture
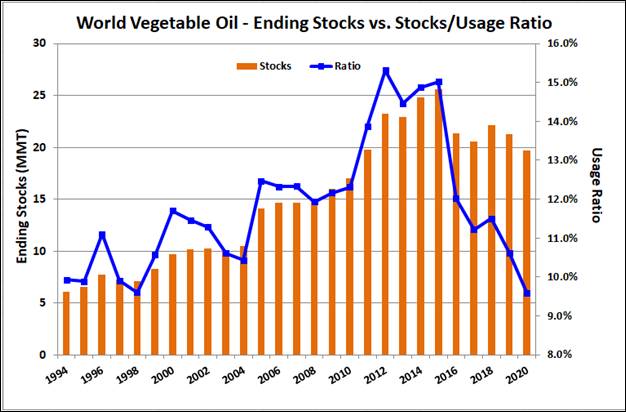
- The stocks:usage ratio for world edible oil stocks has dropped steadily over recent years to the lowest level since 1998. [See chart below.]
- The spread of African Swine Fever in SE Asia is a troubling development for meal demand; adding pressure to soybean processing, which in turn creates potential for decreased SBO production. The decrease of crushing in China has led to increased oil imports: cumulative imports of all oils up 50% y/y with soy-oil purchases up 75%.
- India’s soybean output in 2019 is likely to fall nearly 18% from a year ago. Lower production could force the already biggest edible oil importer to raise overseas buying of palm oil, sunflower oil and soy oil.
- Adding additional to soybean processor crush incentive, soybean crush margin has fallen from a high near $1.10 to just 76 cents, nearly half of last year’s margin.
- US SBO stocks continue to drop y/y; now at lowest level since November 2017.
- Some early warning signs have emerged out of Brazil, where the northeast area shows heat and dryness through much of the summer in the extended forecasts. Other areas of Brazil are more “normal.” Argentina forecasting drop in planted area and production. CWG says rain prospects for both Brazil and Argentina likely to improve into month end.
- US soy production remains uncertain but USDA has steadily cut estimated ending stocks from June—now less than half of the June estimate, dropping usage ratio from 25% to 11.4%.
- Anticipating lower soy production in tandem with ample on-farm storage, producers are likely to hold beans from the market—especially in the context of increased buying from China.