With an initial 5-wave move off the bottom made on September 3rd, Kansas City wheat is poised to make new highs in the coming weeks/months. The only core patterns of Elliott Wave that begin with a 5-wave move are the Impulse, Leading Diagonal (at times), and the Zig-zag. All of these patterns call for a new price extreme in the direction of the current trend whether it is a wave 3 (violently higher) or a wave C higher.
Our interpretation below is that we will see a wave 3 higher. But, this market has some potential for further retracement into the value zone first. That should be deemed as an excellent buying opportunity to extend coverage as far as possible. For buyers that currently have open risk, it may be prudent not to wait for the pullback and cover some of your risk now given the potential of an upside price spike.
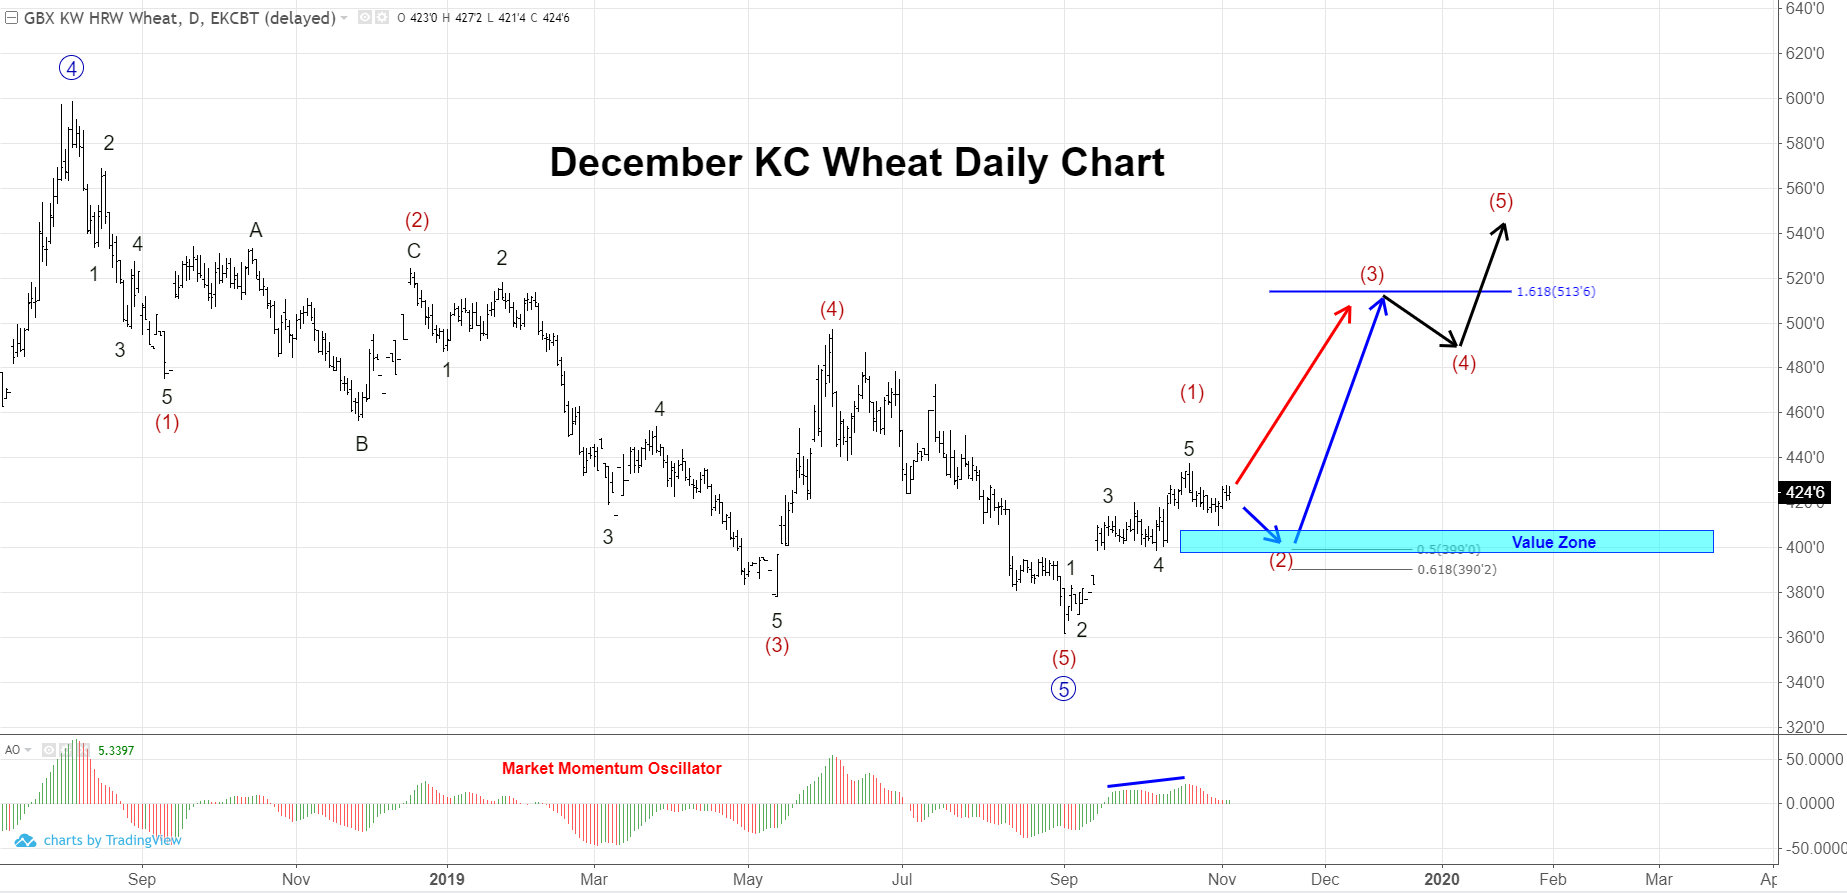
Looking at other technical indicators for clues of confirmation or concern, we see the following:
- Momentum on the Daily Chart peaked at the most recent high in price. This is confirming that we should see a new price high.
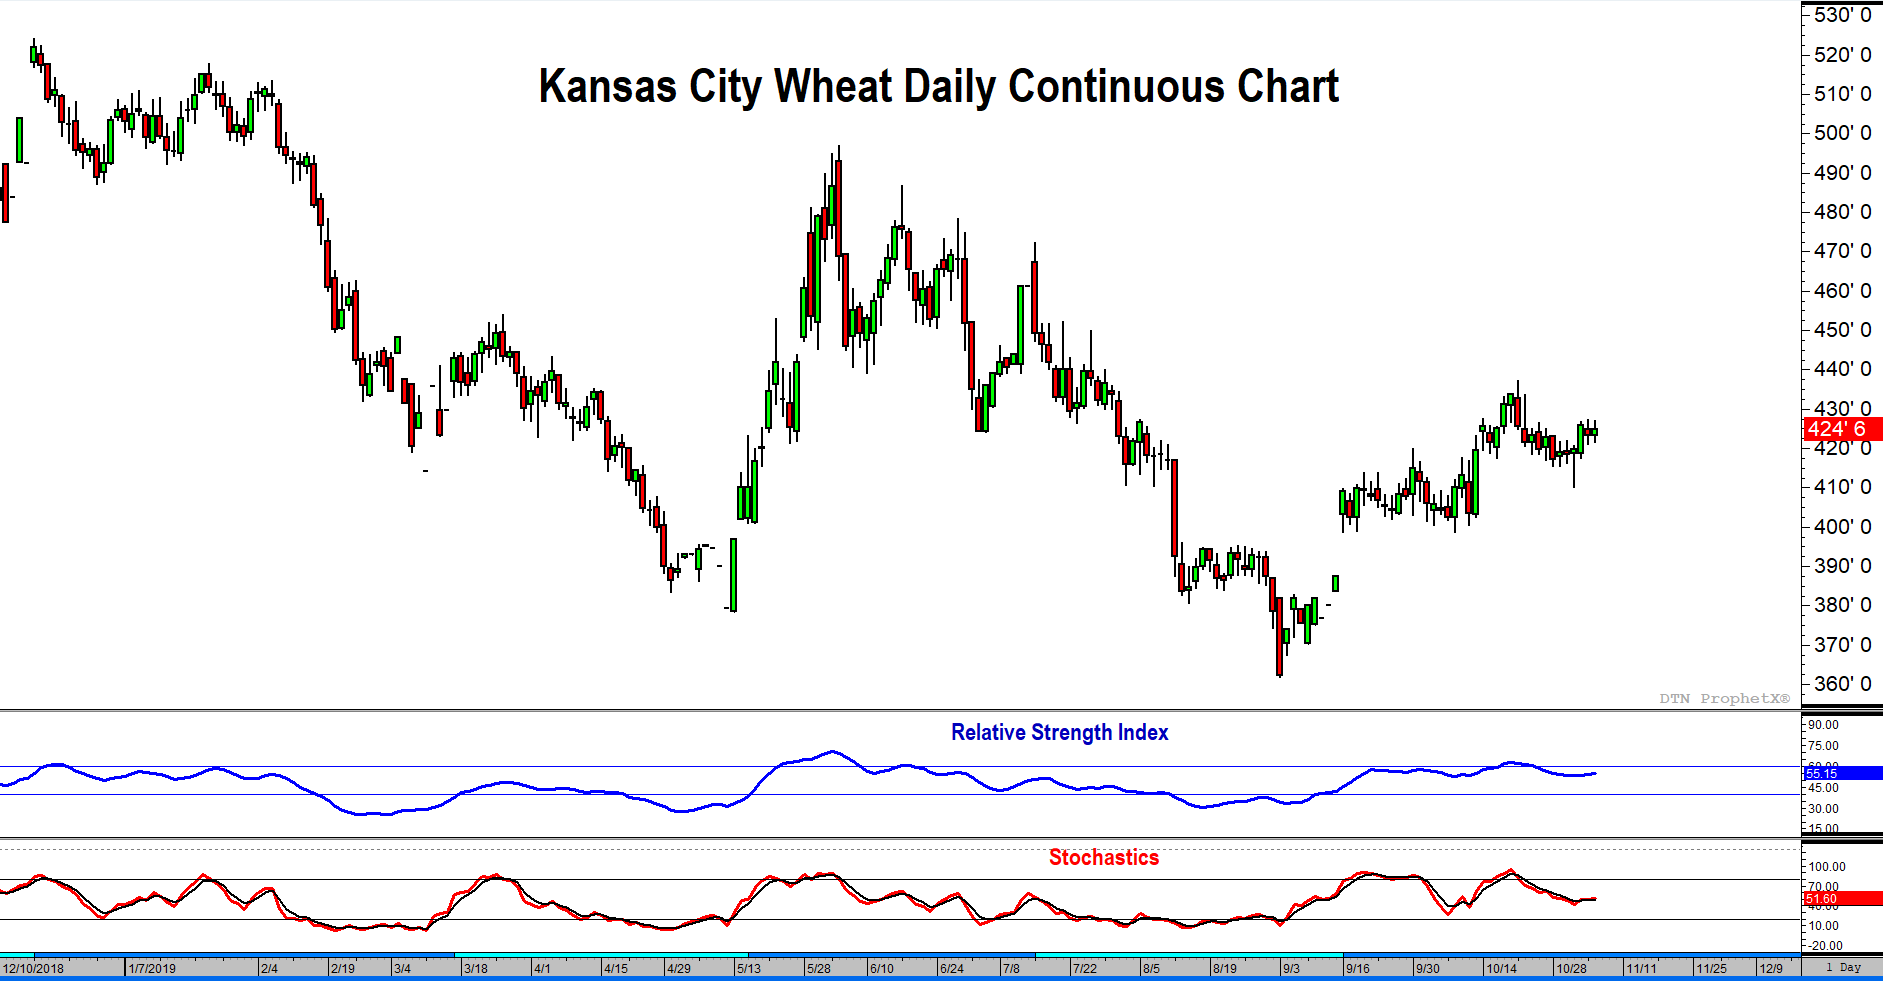
- The Relative Strength Index breached bear market resistance (60), but did not stay above. We would like to see RSI re-establish itself above 60. This will help confirm that the previous, overall downtrend is over. As long as RSI stays above 40, we will consider this current uptrend intact.
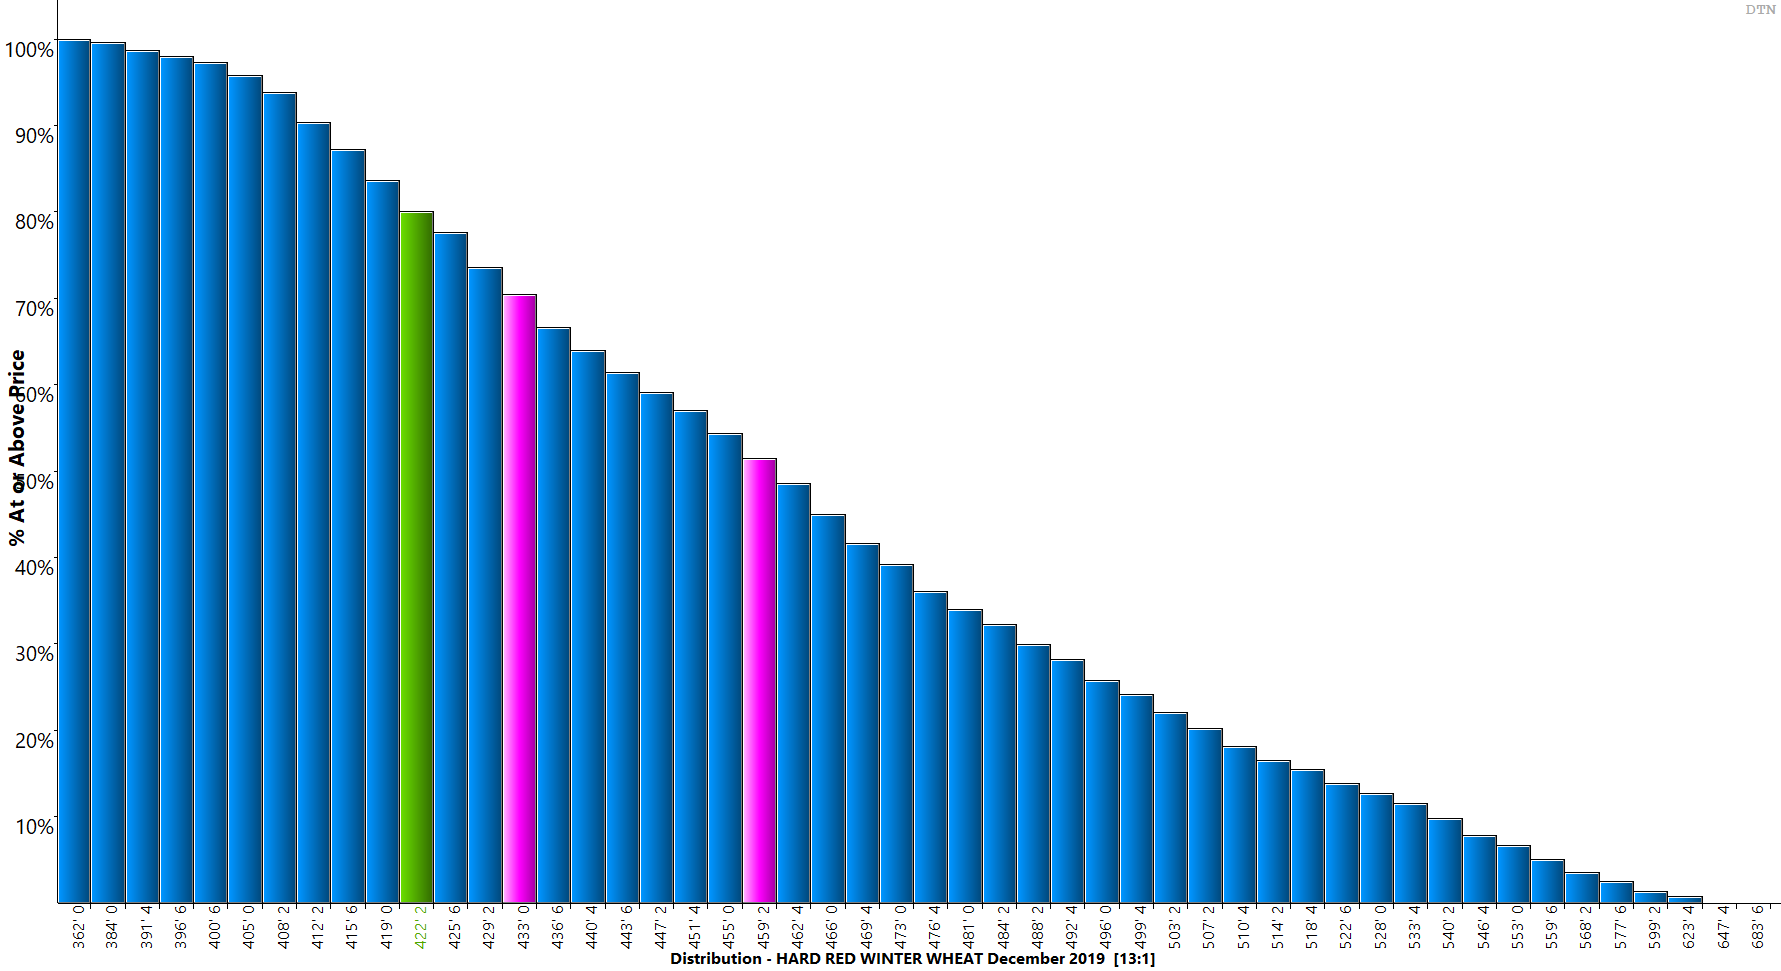
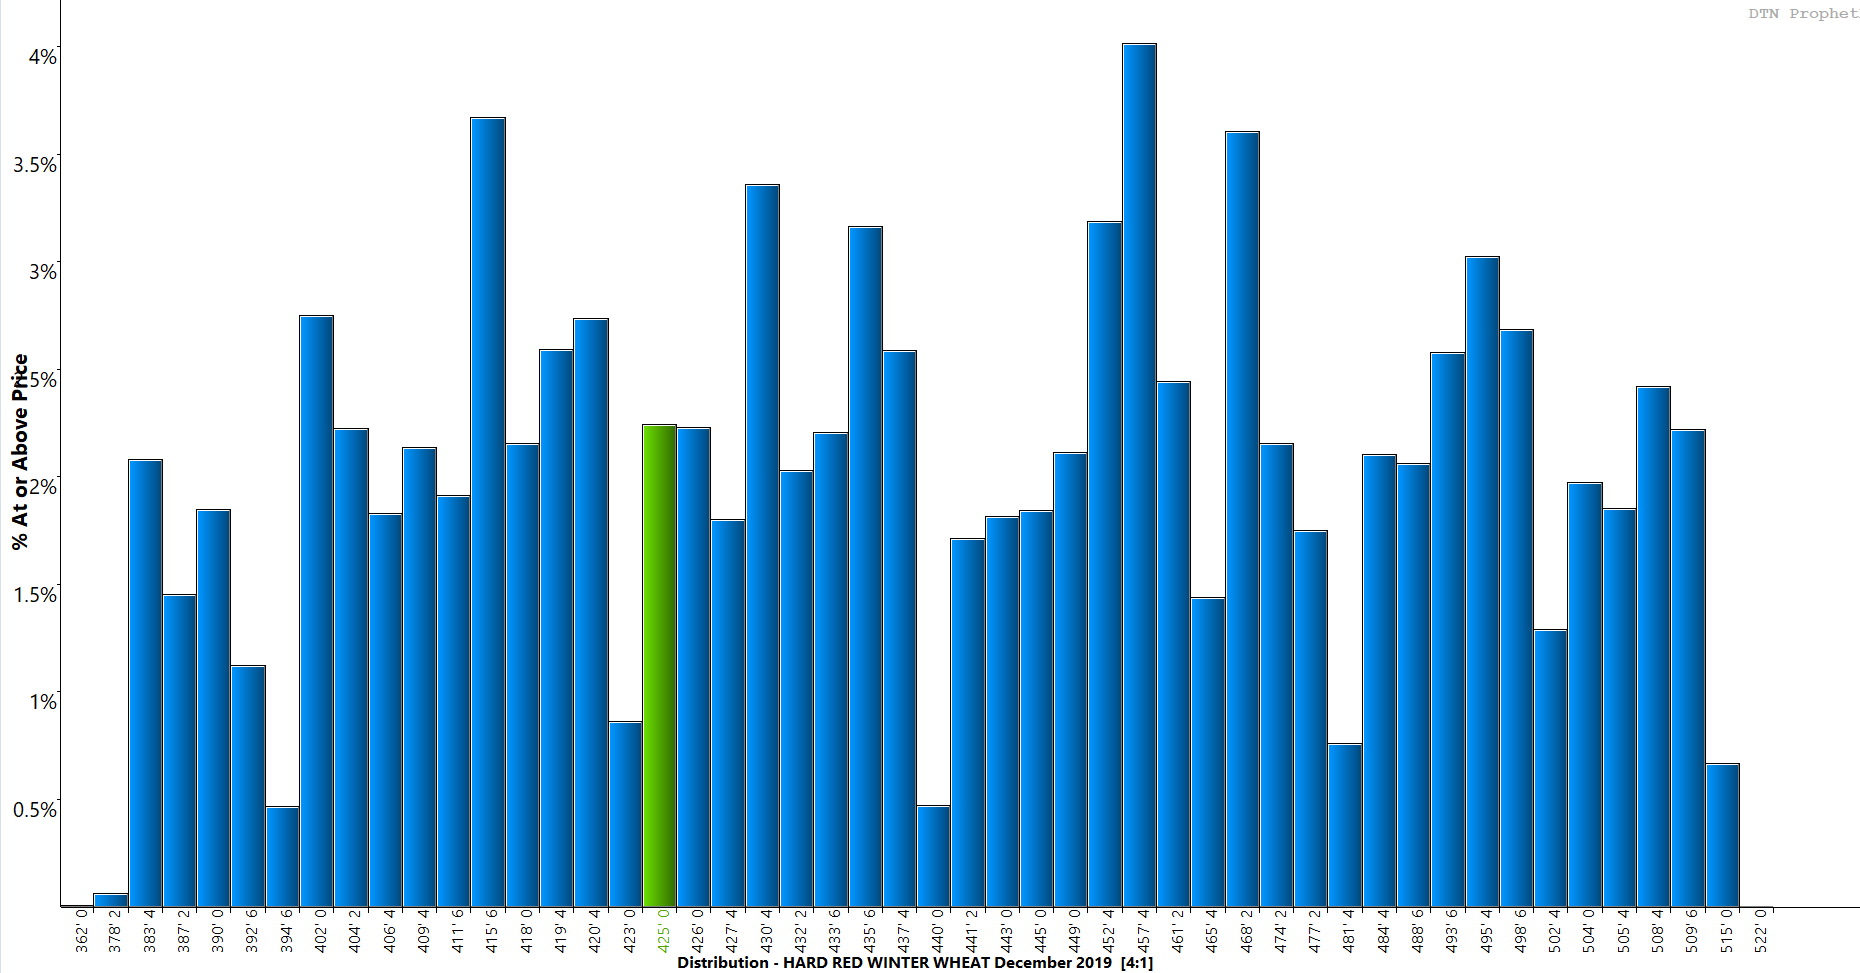
The final three statistical charts offer confidence to a buyer who is indecisive in pulling the trigger.
- The price distribution chart shows that current price levels are below 80% of the prices traded in the last 3 years.
- The volume distribution chart shows that 70% of the volume in the past 12 months traded at levels higher than currently offered….you are doing better than the majority of your competition.
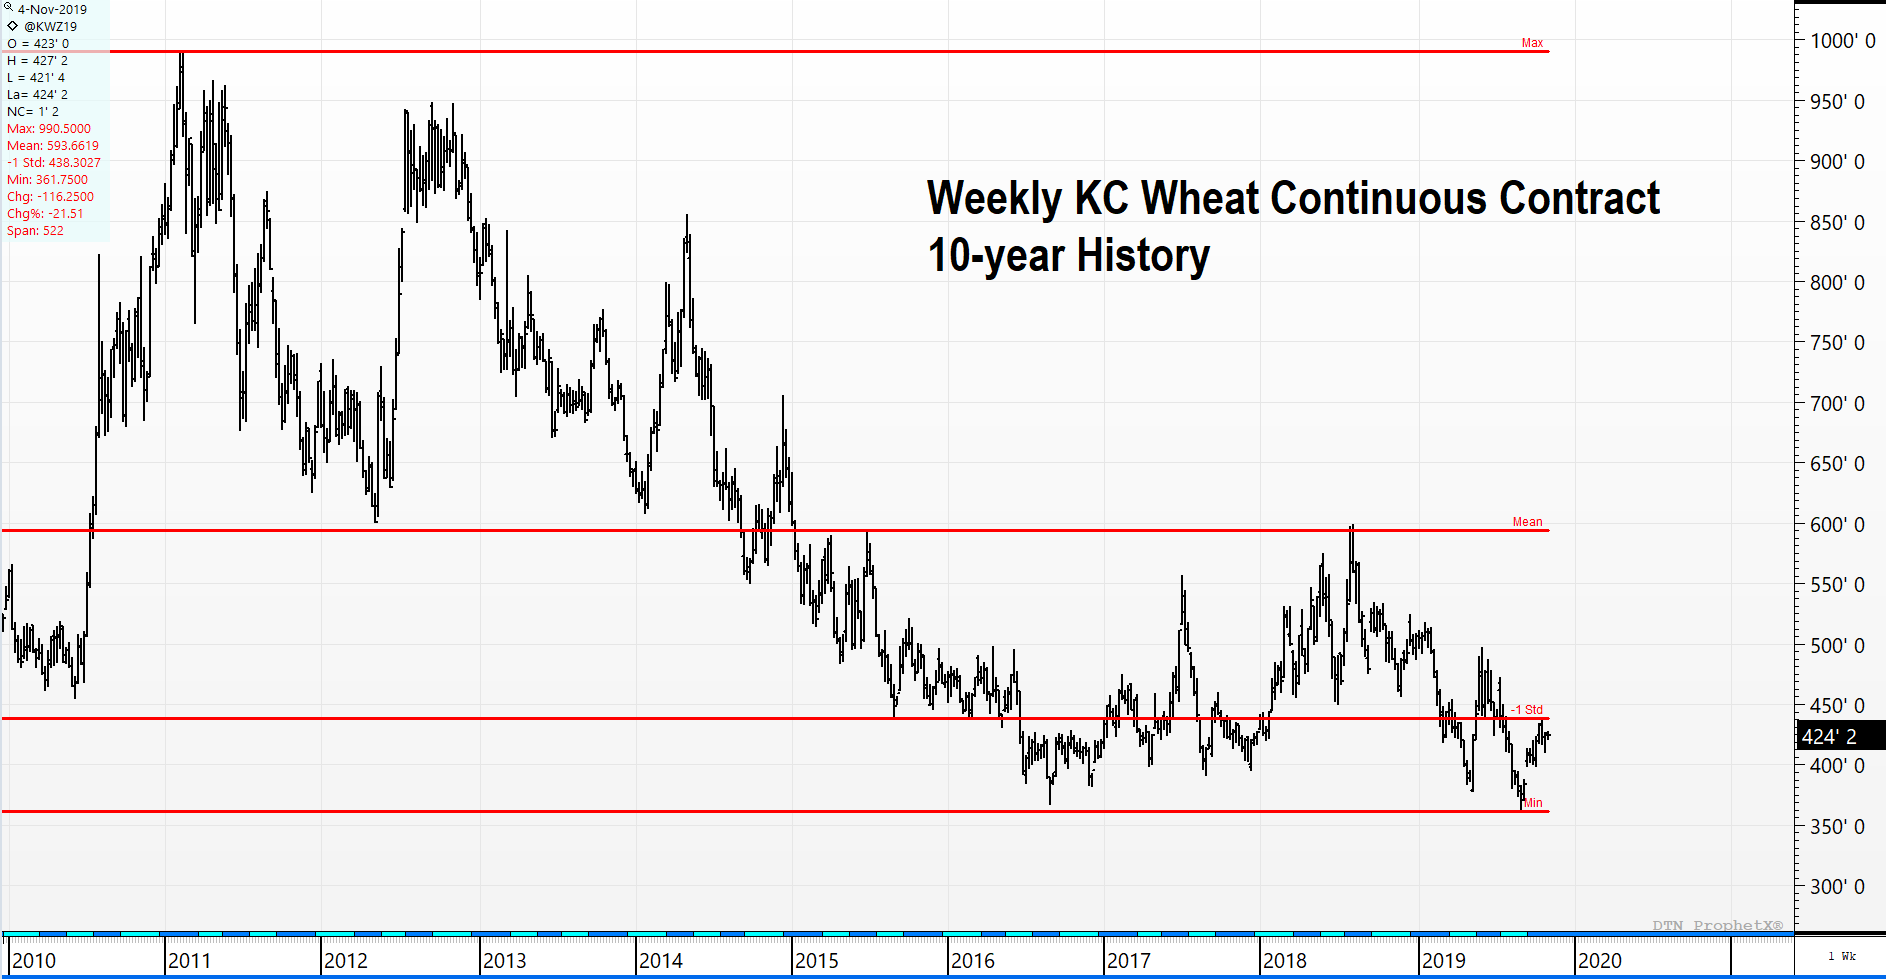
- A 10-year history of the continuous wheat contract illustrates that current prices are well-below the mean value of that time period; in fact, we are more than 1 full standard deviation from the mean. That shows significant value being offered.
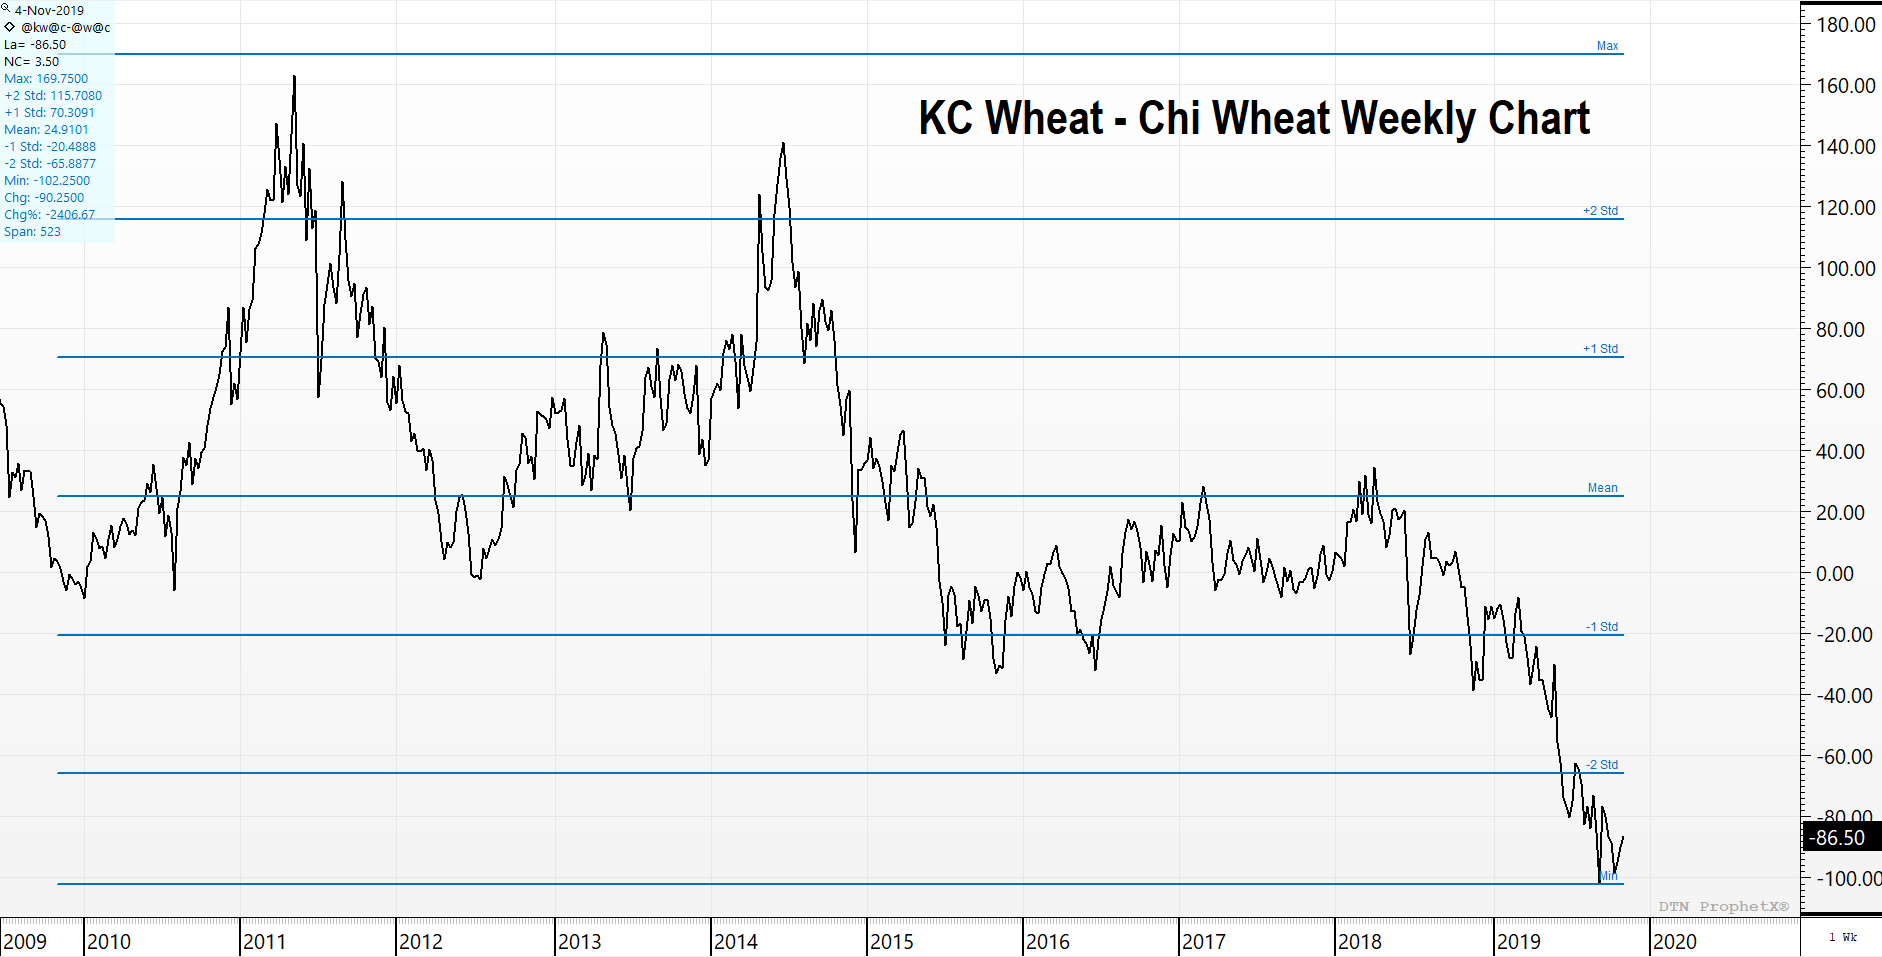
As a bonus, you can see that KC Wheat is at a historic low compared to Chicago Wheat. Whether this spread reverts to its mean by Chicago falling or KC rising, by purchasing your KC wheat at these levels, you are on the right side with a potential advantage.
Fundamental Comments & Information:
- 2020 US Hard Red Winter wheat (HRW) area unchanged to slightly lower (US winter wheat acres already near 100 year lows). Farmers reaping higher returns from dryland corn than HRW.
- HRW crop, despite dry pockets including Southwest Kansas, in good shape although 2020 yields unlikely to match excellent 2019 returns.
- Tight holding will persist by farmers who believe NASS overstating production
- S. hard red winter wheat (HRW) low protein wheat had come back into competitiveness in world markets, but recent surges in basis have once again made U.S. wheat too costly. U.S. HRW 11% protein wheat basis rose a reported 19 cents to 132 over nearby futures on Monday, while basis levels in the U.S. spring wheat market also rose sharply as the trade seeks high quality wheat. Spring wheat 14% protein premiums are said to be up 20 cents in the past week, and have moved 50 to 70 cents higher in the past several weeks.
- Winter wheat planting is now 89% done, up 4% on the week. The crop is rated at 57% good to excellent, and that is up 1 percentage point.
- With the forecast calling for below normal temperatures the next two weeks, it doesn’t look likely a great deal more planting will take place. Also, national emergence is just 71% vs. 74% average. The cold temperatures won’t allow much more wheat to emerge from the ground, creating a potential yield penalty if the growth needs to be made up in the spring.
- Wheat export inspections last week were just 10.8 mb and well below the weekly average required to achieve USDA’s yearly projection. However, total inspections are 401 mb compared to just 329 mb a year ago so far — up 22%. DTN National HRW Index closed at $3.97 and, and the average basis is at 26 cents under December.