This post is a follow up to our July 1st post, “Don’t Be The Chicken Looking For The Last Corn Kernel”
Time to Buy December Corn Futures?

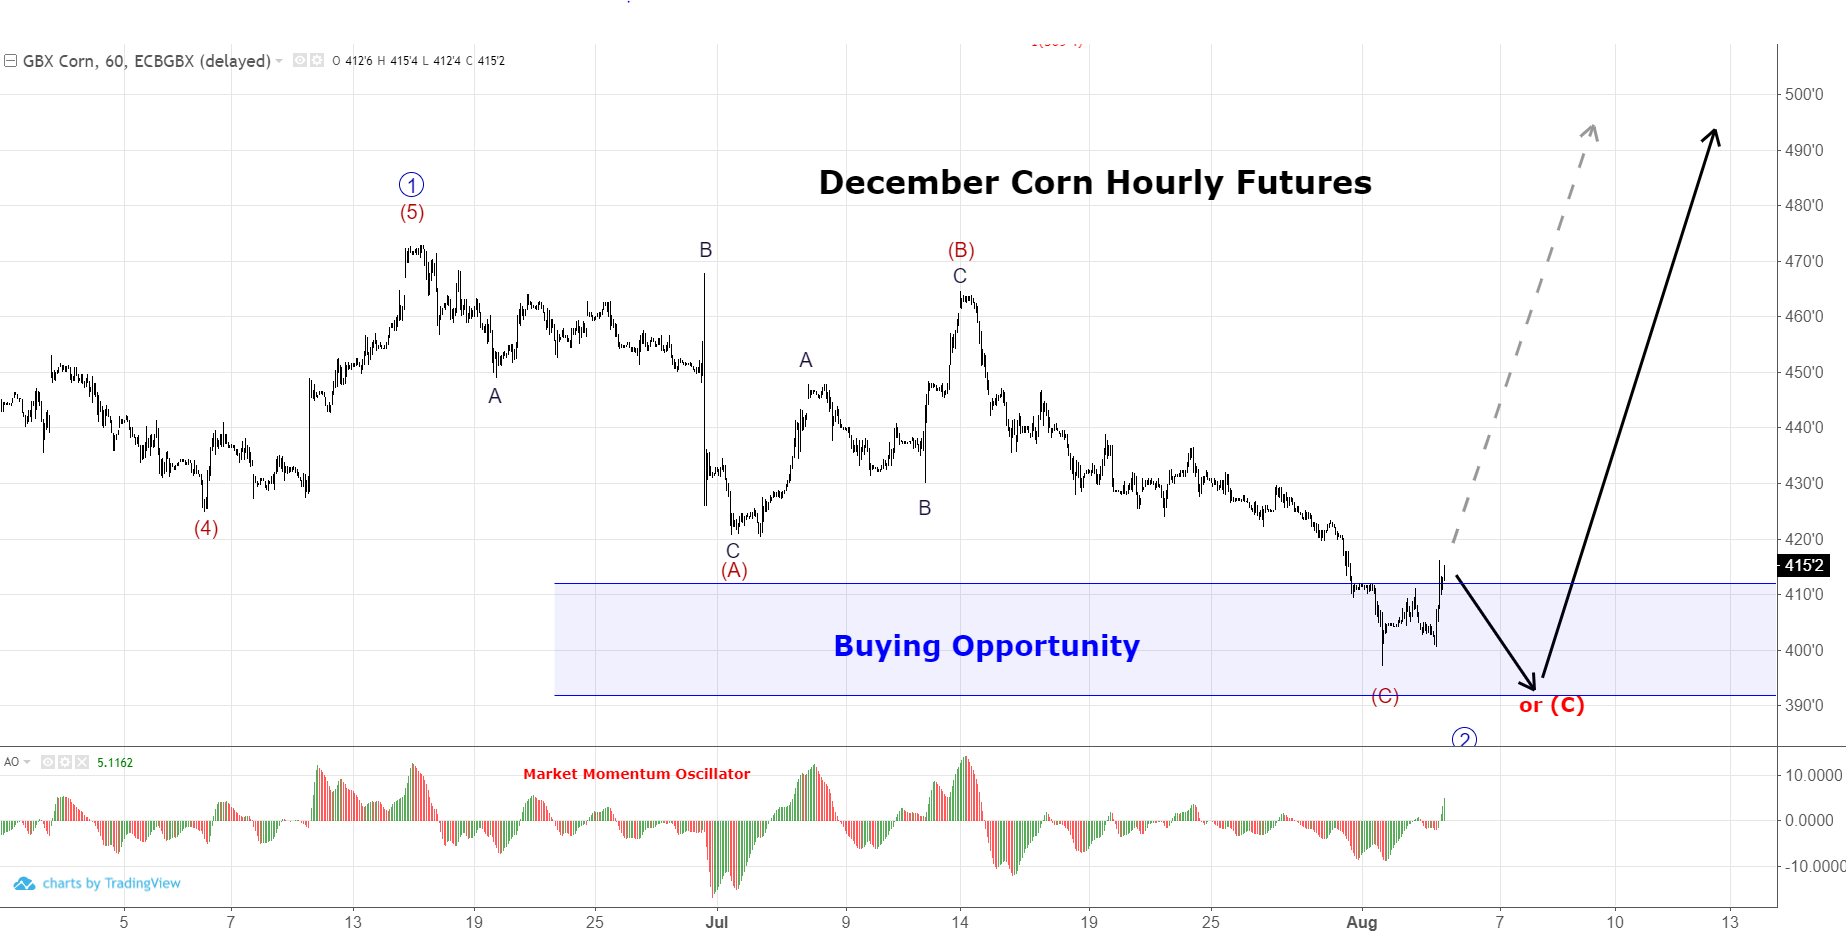
December Corn Futures have declined into the buying opportunity zone as predicted in our July 1st post. Of the two wave interpretations given at that time, it has followed the second. To find out how to use multiple wave interpretations to build confidence or to act accordingly as the market moves, please see post given on June 18th, on Soybean Oil.
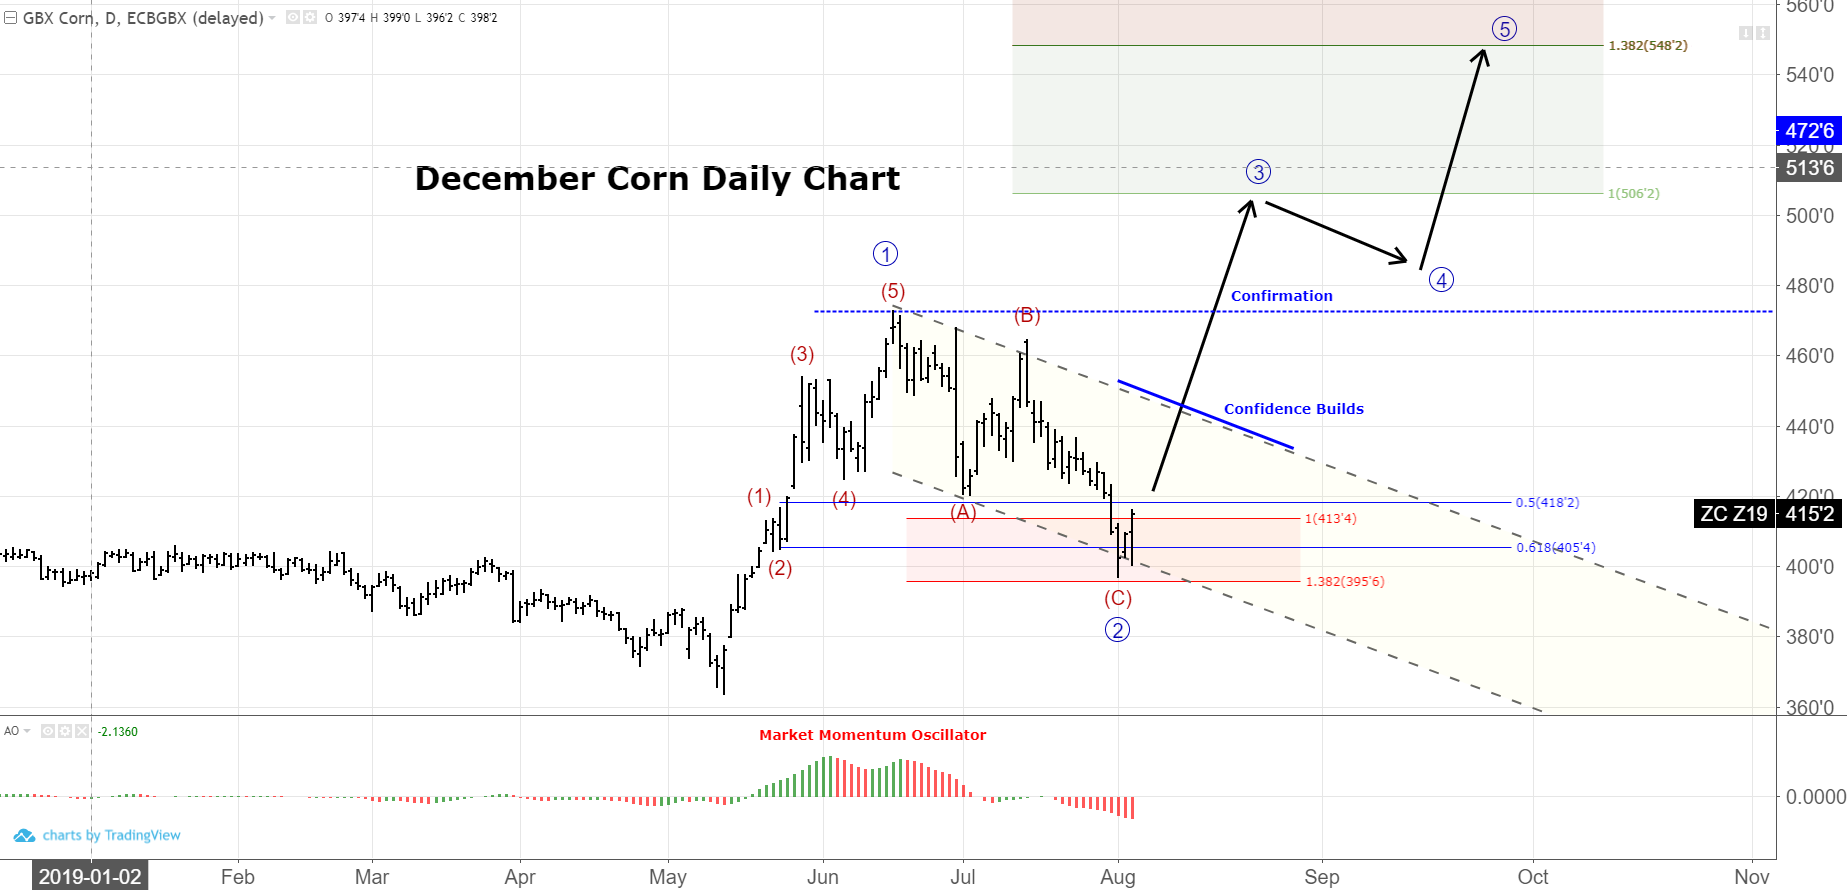
Looking at the hourly chart, you can see we have entered the buying opportunity zone. The market has traced out 5 clear waves higher (1)-(5), followed by a 2 wave decline (A)-(B)-(C) targeting the 50-62% retracement levels. The decline has also occurred within parallel lines. Wave (C) is 1.382*Wave (A).

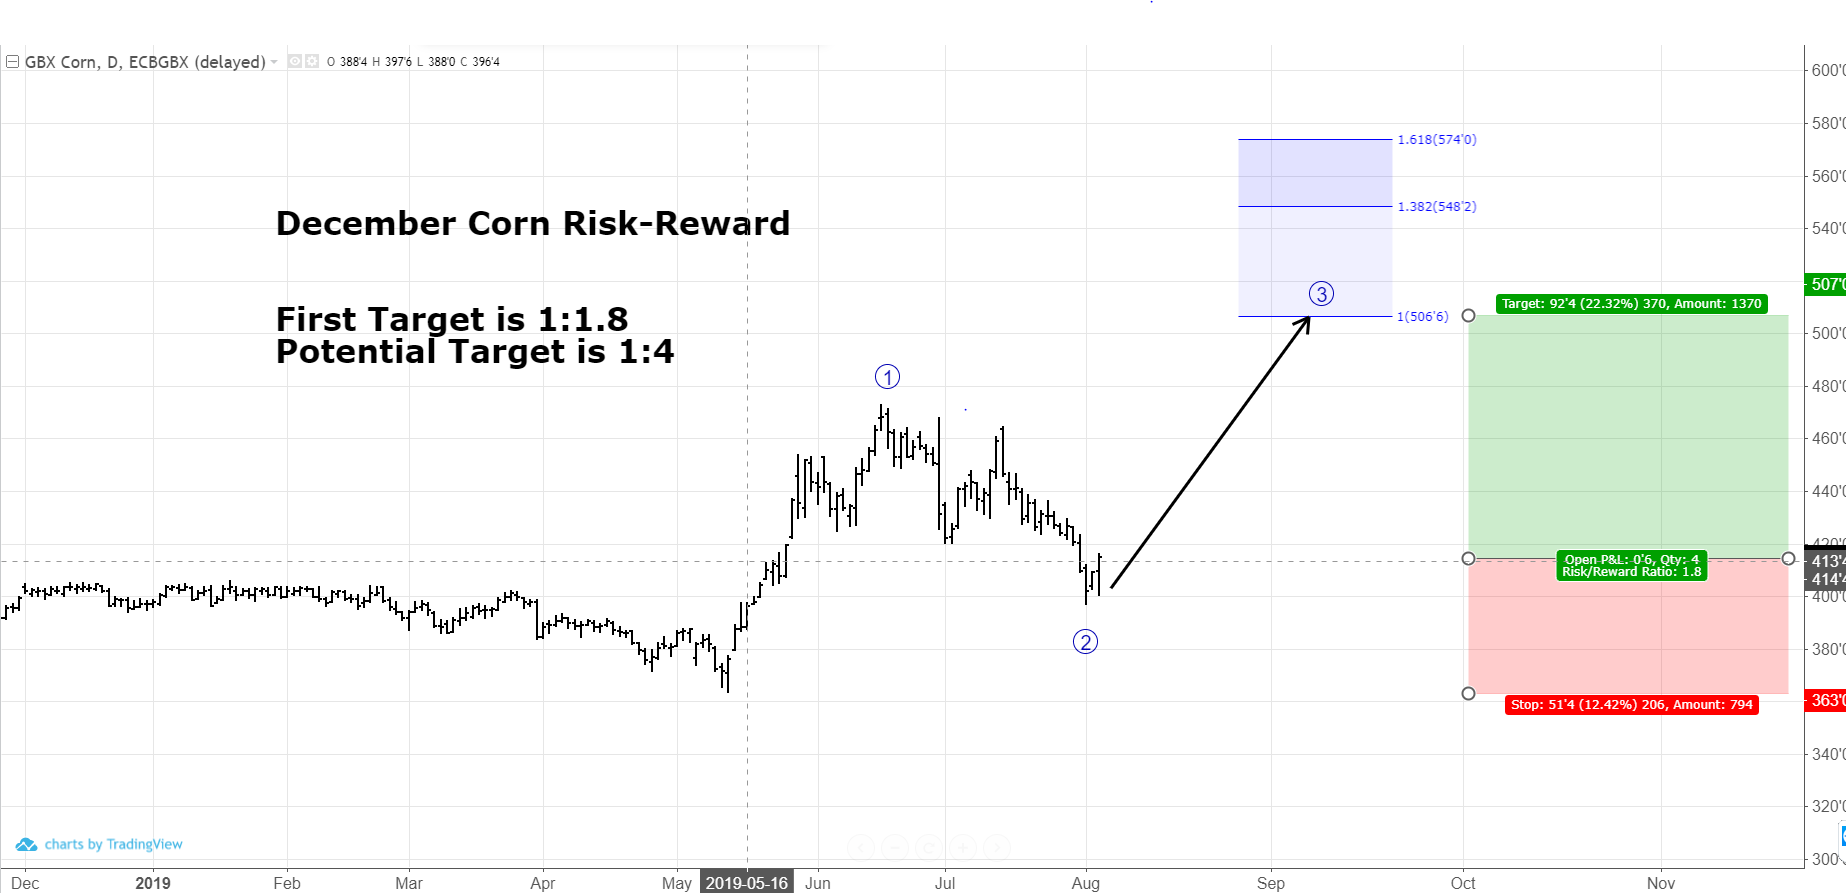
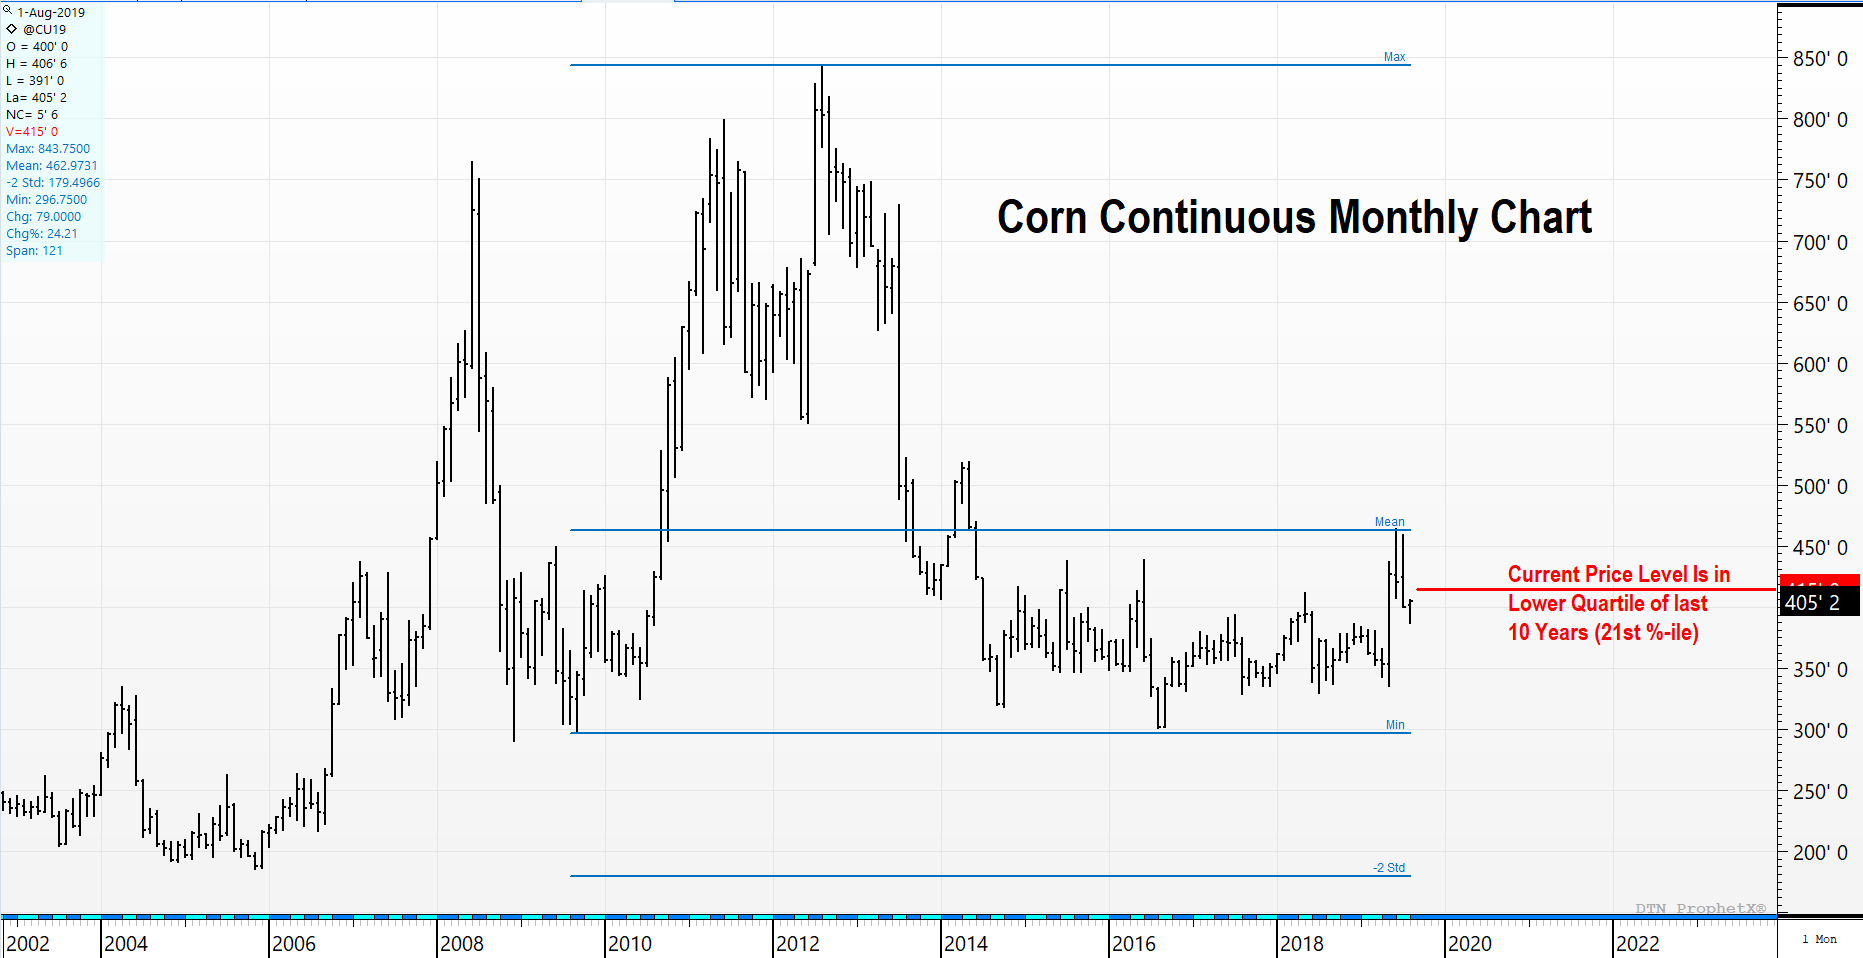
If we take our minimum upside price target and measure that against a new price low of $3.63 (note: traders can use stop-levels much tighter to manage risk), we get risking $1 to make $1.80. Not bad. However, if we take our potential target of $5.74, the risk:reward becomes 1:4. That is good. Put this in the context of prices being at historically low levels over 10 years (see Corn Monthly chart below for lowest quartile buying opportunity), and buyers should become very confident in adding coverage against their needs.
This forecast will gain confidence if we settle above the upper channel line of the price channel on the daily chart. Confirmation comes in with another new price high. At that point, price and indicator information will give clues on whether the minimum target or more aggressive target is more probable.


December Corn News Recap
- Funds sold close to 35,000 contracts of their net long through last Tuesday but remained long 112,000 contracts as of last Tuesday. Coming into Monday trade it is estimated funds may still be long 45,000 to 50,000 contracts.
- June Census corn exports totaled 3.068 mmt, the smallest total for the month since 2013 and the smallest outright month since November 2017. Corn export inspections continue to lag last year by nearly 16% and last week’s 24.6 million bushels (mb) was well behind the weekly average needed with just four weeks left in the crop year.
- U.S.-China trade tensions are on every trader’s mind as China devalued its currency on Monday in an effort to counteract more proposed U.S. tariffs on Chinese imports.
- While U.S. weather has been favorable in the northern and Western Corn Belt, dryness seems to have expanded and worsened in some parts of the eastern Midwest, with Illinois, Indiana and Ohio in dire need of some rains; topsoil moisture there now said to be the shortest in the past seven years.
- Corn conditions, at 57% good to excellent, fell 1 percentage point, and remain the lowest in seven years. Silking is now at 78% compared to a five-year average of 93%.
- Private crop yield and production numbers continue to flood the media, with the latest from a Farm Futures survey pegging planted acreage at a much lower 83.5 million acres, yield at 167.2 bushels per acre (bpa), and a crop of 12.7 billion bushels (bb) — a far cry from INTL FC Stone’s 13.9 bb crop production number.
- On the demand side, U.S. corn continues to suffer with Argentine FOB corn offers said to be a $15 per metric ton discount, and Brazil offers slightly higher.