This post is a follow up from our August 25th post, Sugar Futures Technical Update.
Sugar Futures May Continue Ascent
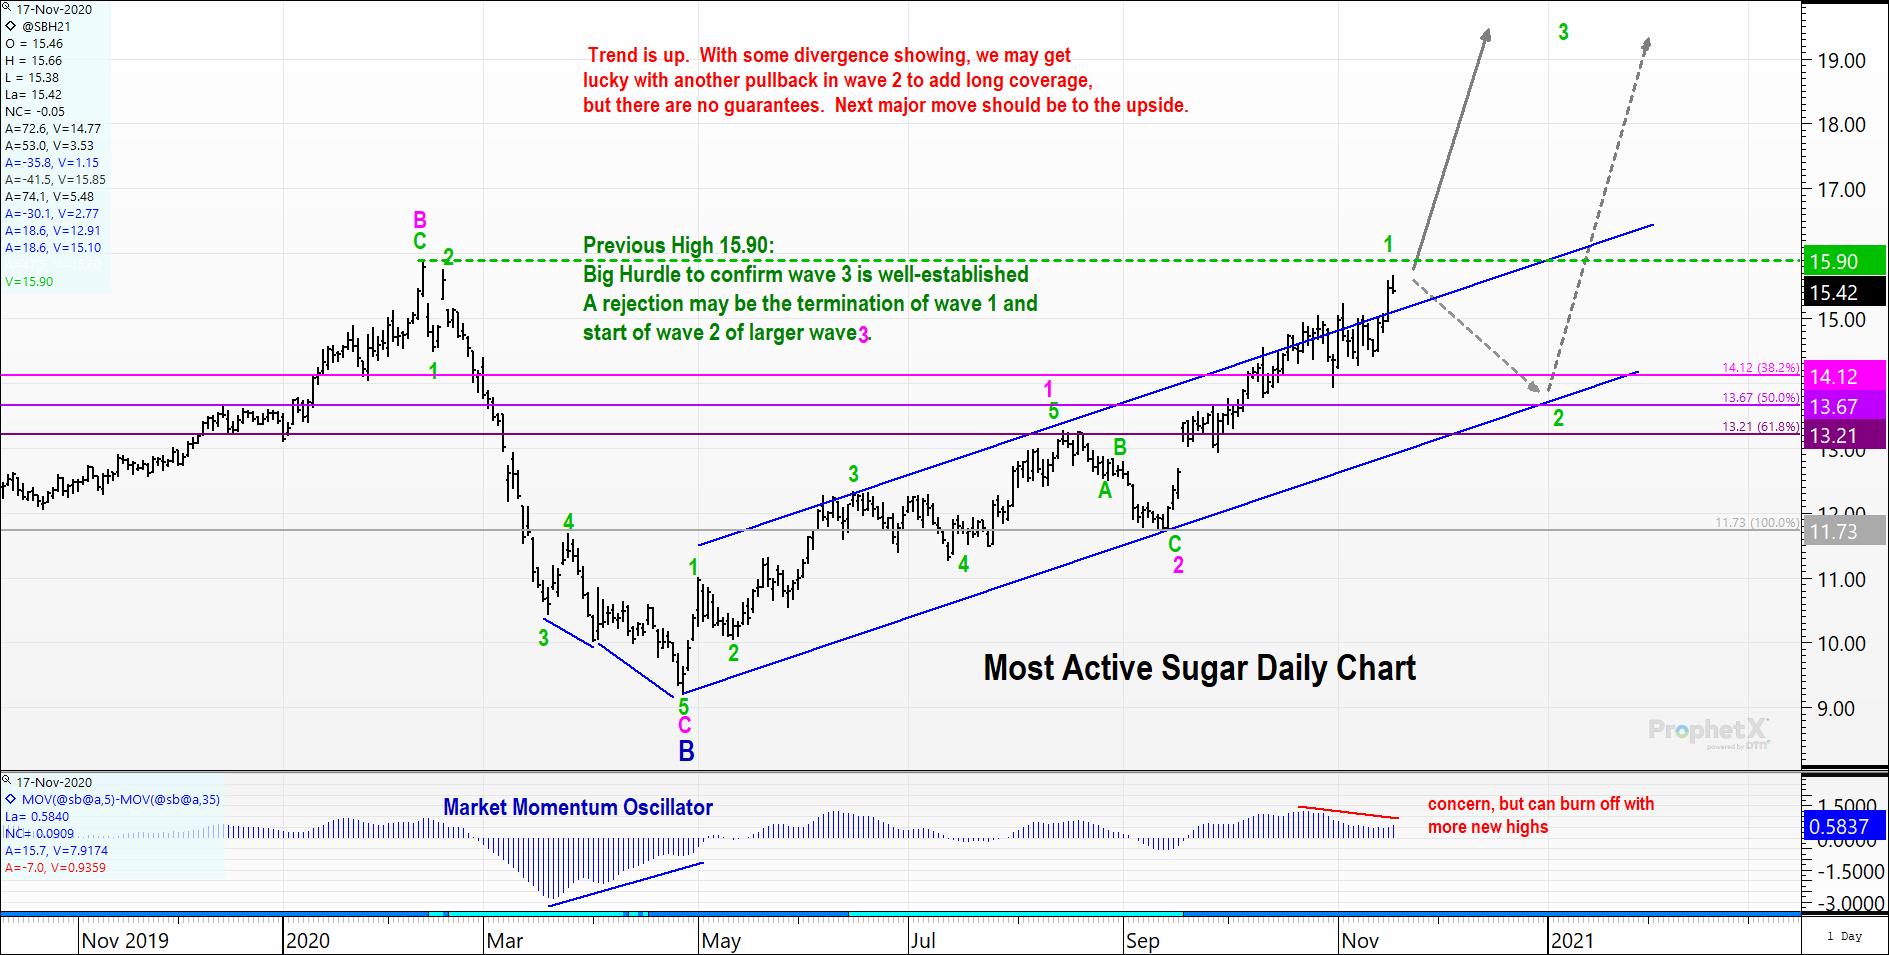
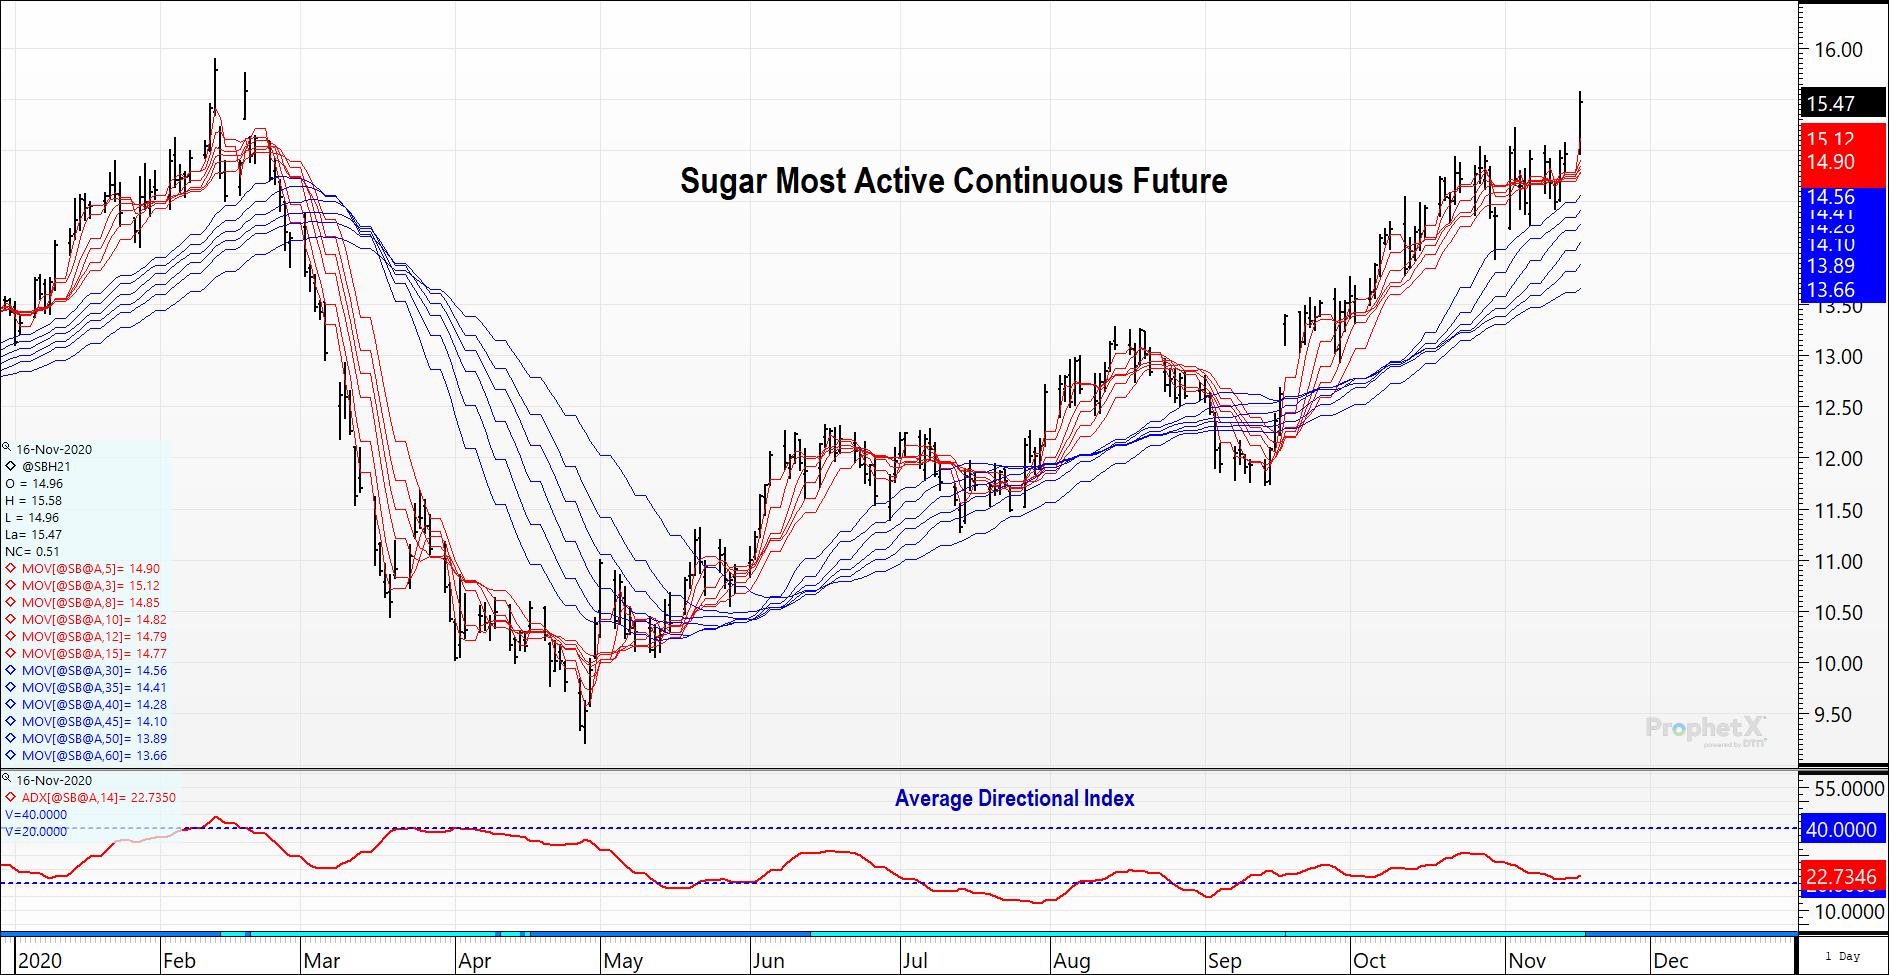
Sugar prices have continued higher in the uptrend we recognized in earlier posts on July 21st and August 25th. Below is an updated chart with our thoughts. Prices have broken above the price channel, suggesting an acceleration of prices to the upside is in play.
The big line in the sand will be the previous high of 15.90 (established on February 12th). If prices can settle above that level, the acceleration higher may be imminent. If that resistance level rejects prices, that should signify termination of wave 1 and the start of a wave 2 pullback.
That wave 2 pullback will be a fortunate opportunity for buyers to add coverage in a well-established uptrend. These waves are all taking place within a larger wave 3 that can be seen on longer term charts.
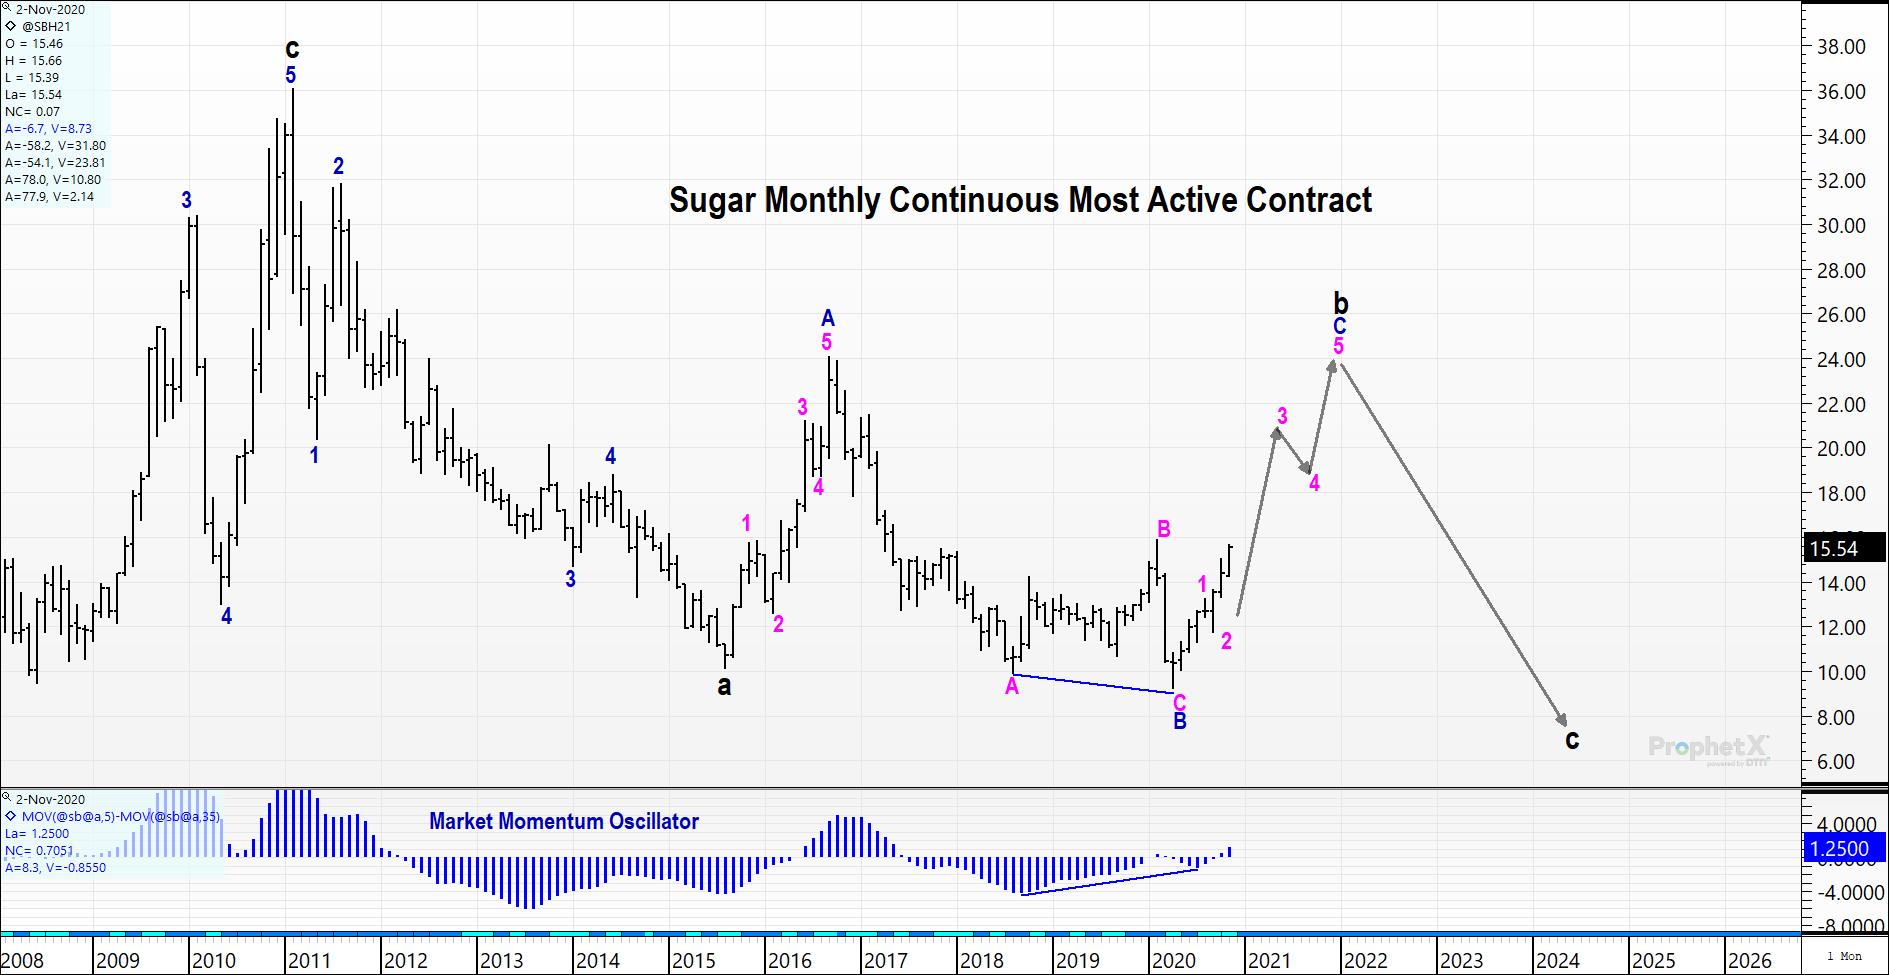
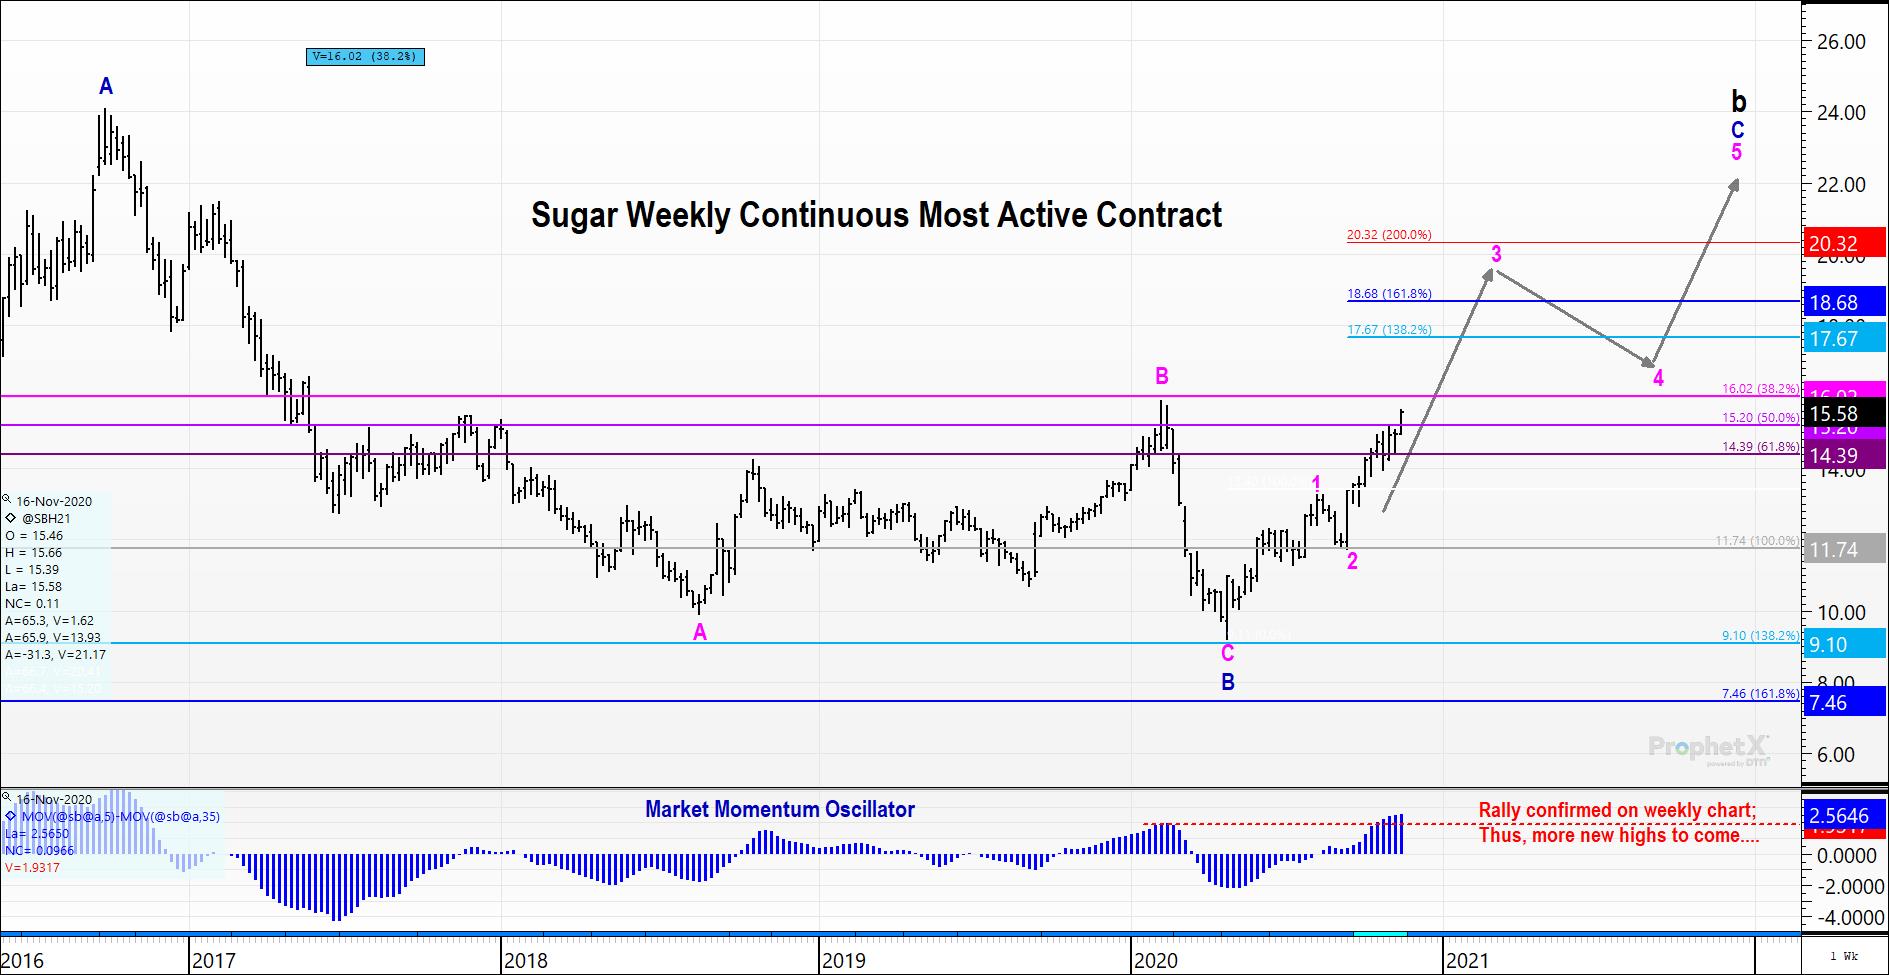
Look for prices to target the 19.00ish area in wave 3 and ultimately near 22.00ish in wave 5 of C of b (see weekly chart) before the long-term uptrend is complete.
Getting a bird’s eye view, you can see the most probable path for prices in 2021. The market momentum oscillator has confirmed the recent rally with new highs. This indicates more new price highs in the future, offering confidence to our wave count.
Getting a Rüppell’s Vulture view, you can get our long-term forecast in the monthly chart below. Here, you can see the bullish divergence between momentum and price on the most recent decline, setting up the current snap-back higher in prices.
Taking a look at some traditional technical indicators for confirmation and/or contradiction
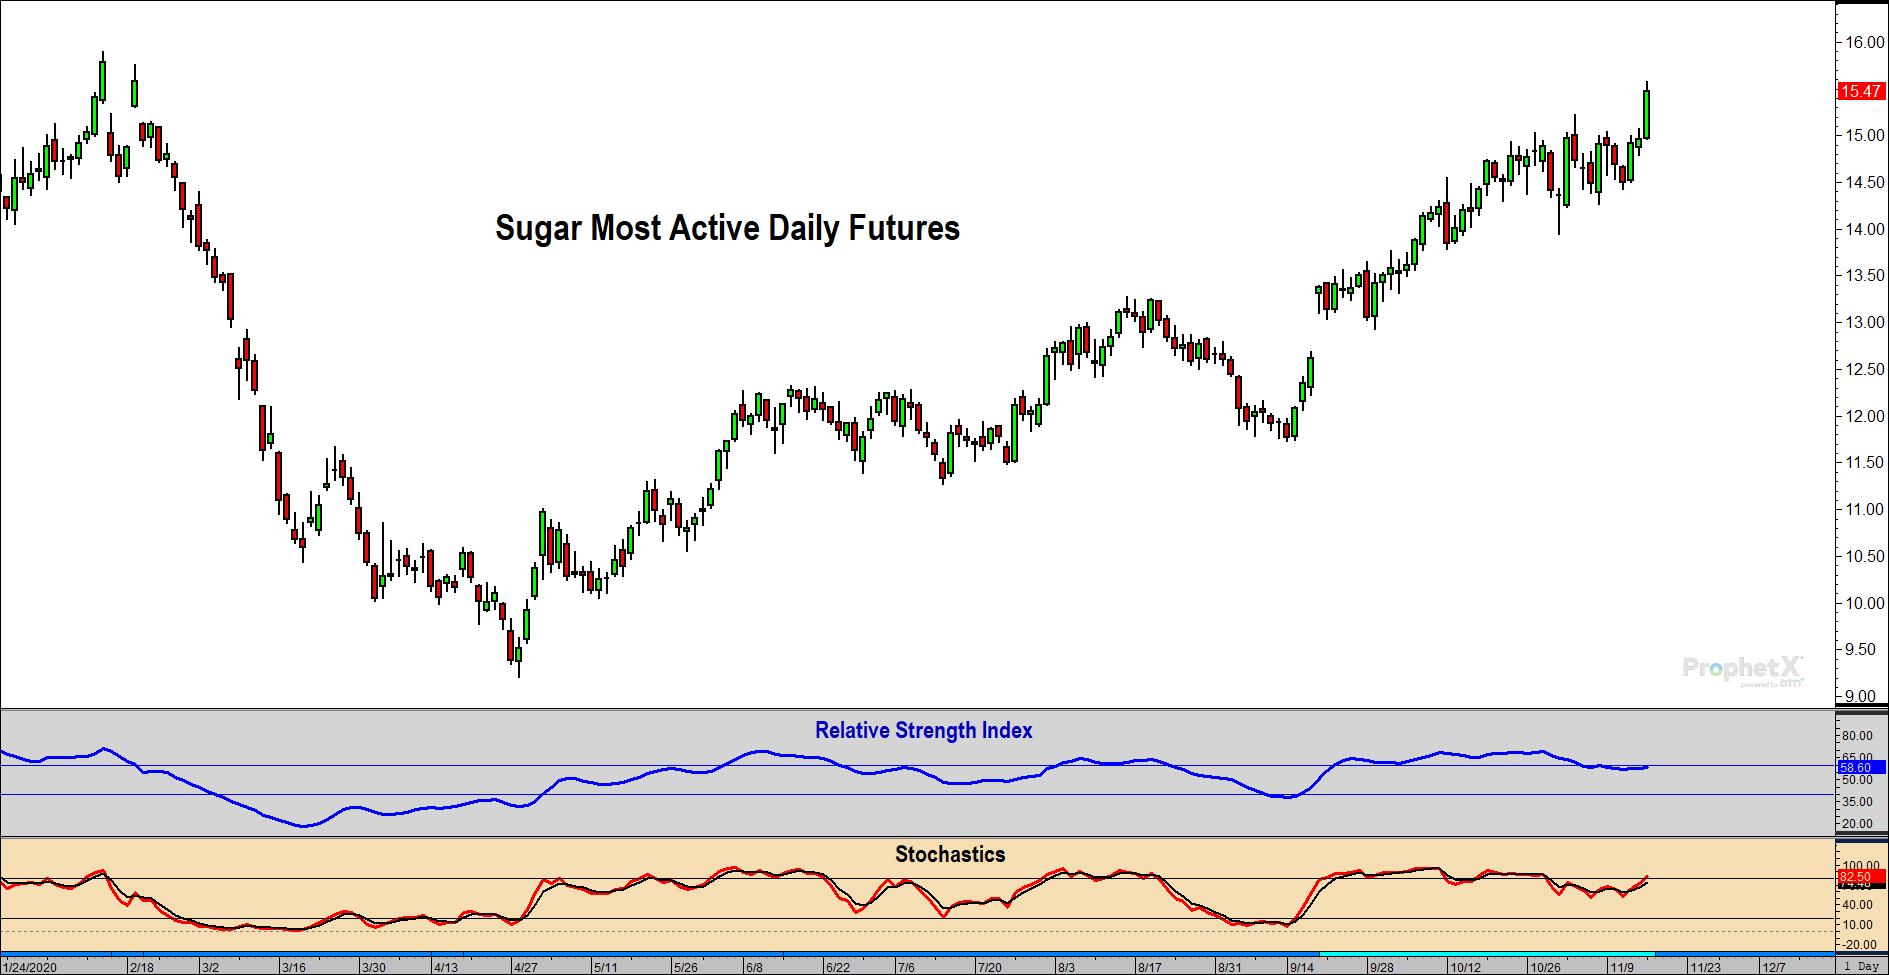
The RSI and Stochastic favor the bullish outlook:
- RSI conquered the 60 level the past few months, suggesting the long-term trend is higher.
- Look for the 40 level to provide support on counter-trend moves lower.
- Stochastics are near overbought, but that condition can remain for some time, as seen in Sep/Oct.
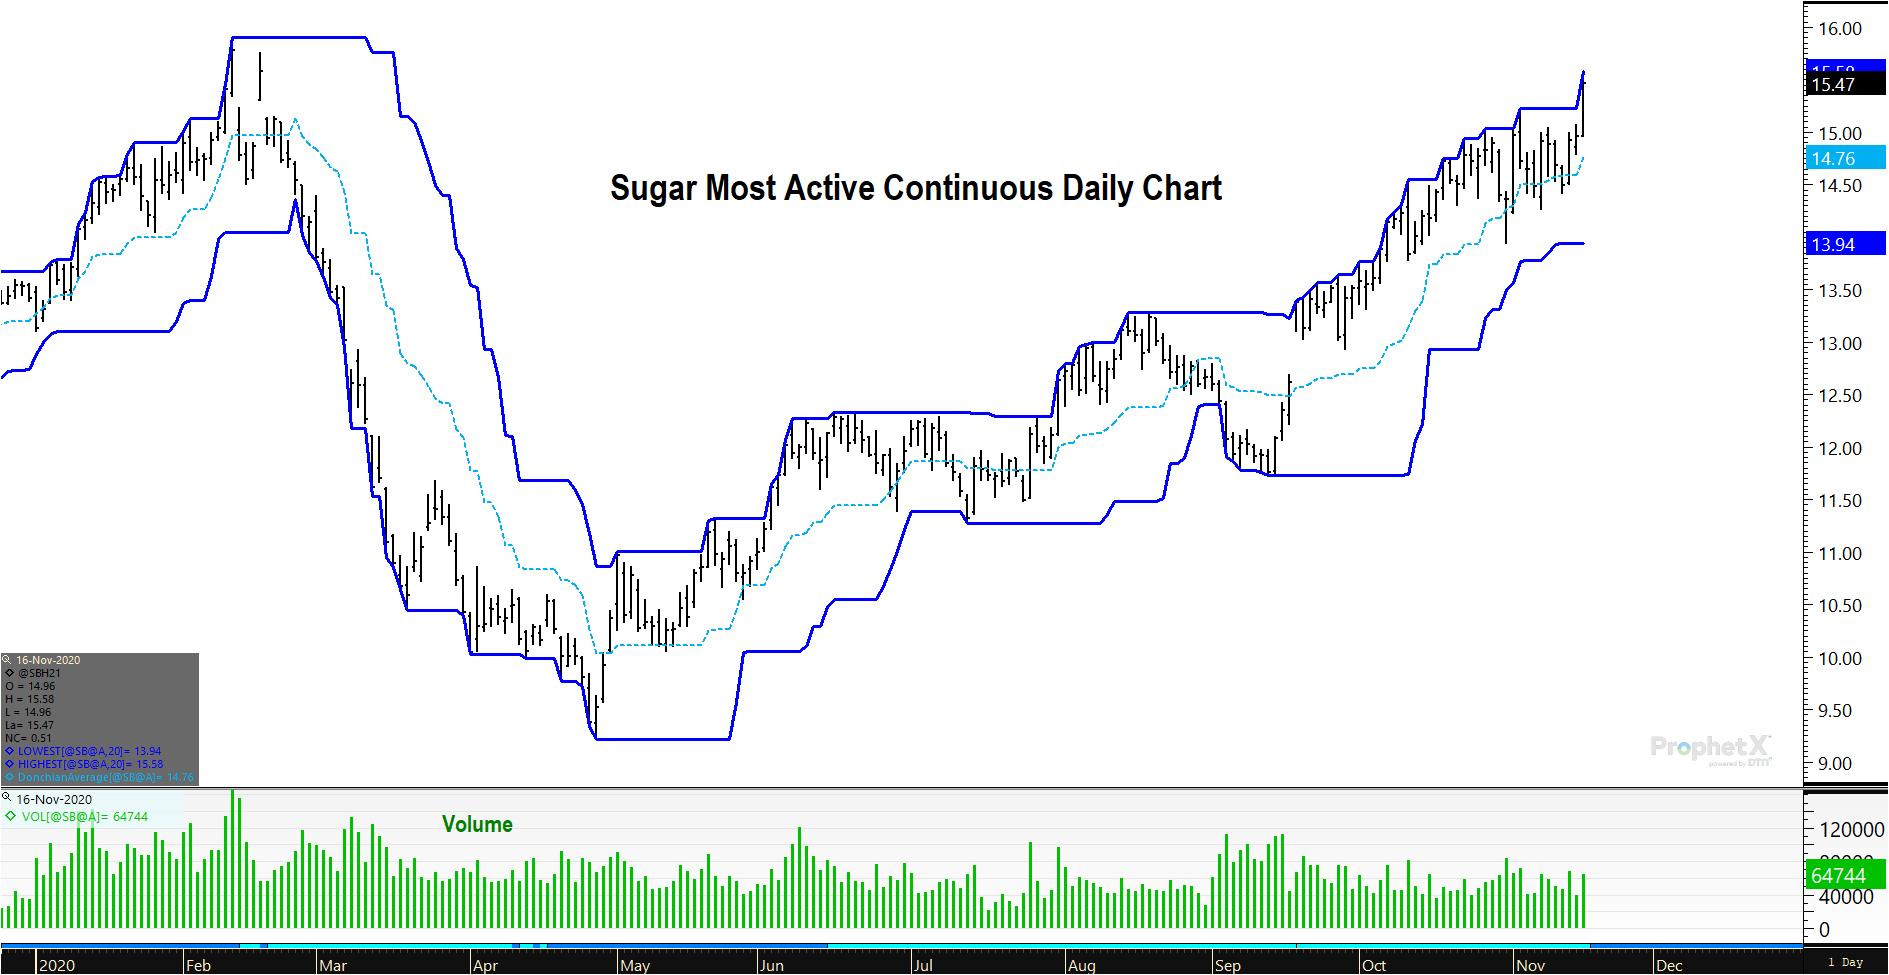
Looking at the Donchian Channel, you can see prices remain in the upper half with the midpoint of the channel providing support on pullbacks. This is indicative of an uptrend. Without prices moving distinctively into the lower half of the channel, confidence can be had with staying long.
Looking at the multiple moving averages visual, you can see the trend is visibly higher, and well established. Prices skyrocketed above all of the listed moving averages, suggesting the market is more bullish now than in a long time.
In addition, the slopes of the moving averages are positive, suggesting the market is getting more bullish than previously.
Note: A good place to add long positions or coverage would be if/when prices retrace back to the longer term averages (50 & 60 day periods).
Bottom Line For Sugar Buyers:
The uptrend is well-established and appears that it will last for some time (through 2021). We may be fortunate to get a wave 2 pullback in price to offer a prime opportunity to add long coverage before an acceleration of prices higher.
Or we may not. Buyers that are short should be aggressive in extending coverage. You can use the 15.90 level in March as a “line in the sand” to make a decision. However, you may be playing with fire as markets have the ability to skyrocket through previous resistance levels in a blink of an eye.
Buyers that have heeded previous advice can remain patient and look for the pullback to add coverage. If prices do rocket through 15.90, their previous positions established at much lower levels will give them the strong hand in weathering the storm and waiting for a better risk-reward buying opportunity to add coverage.
