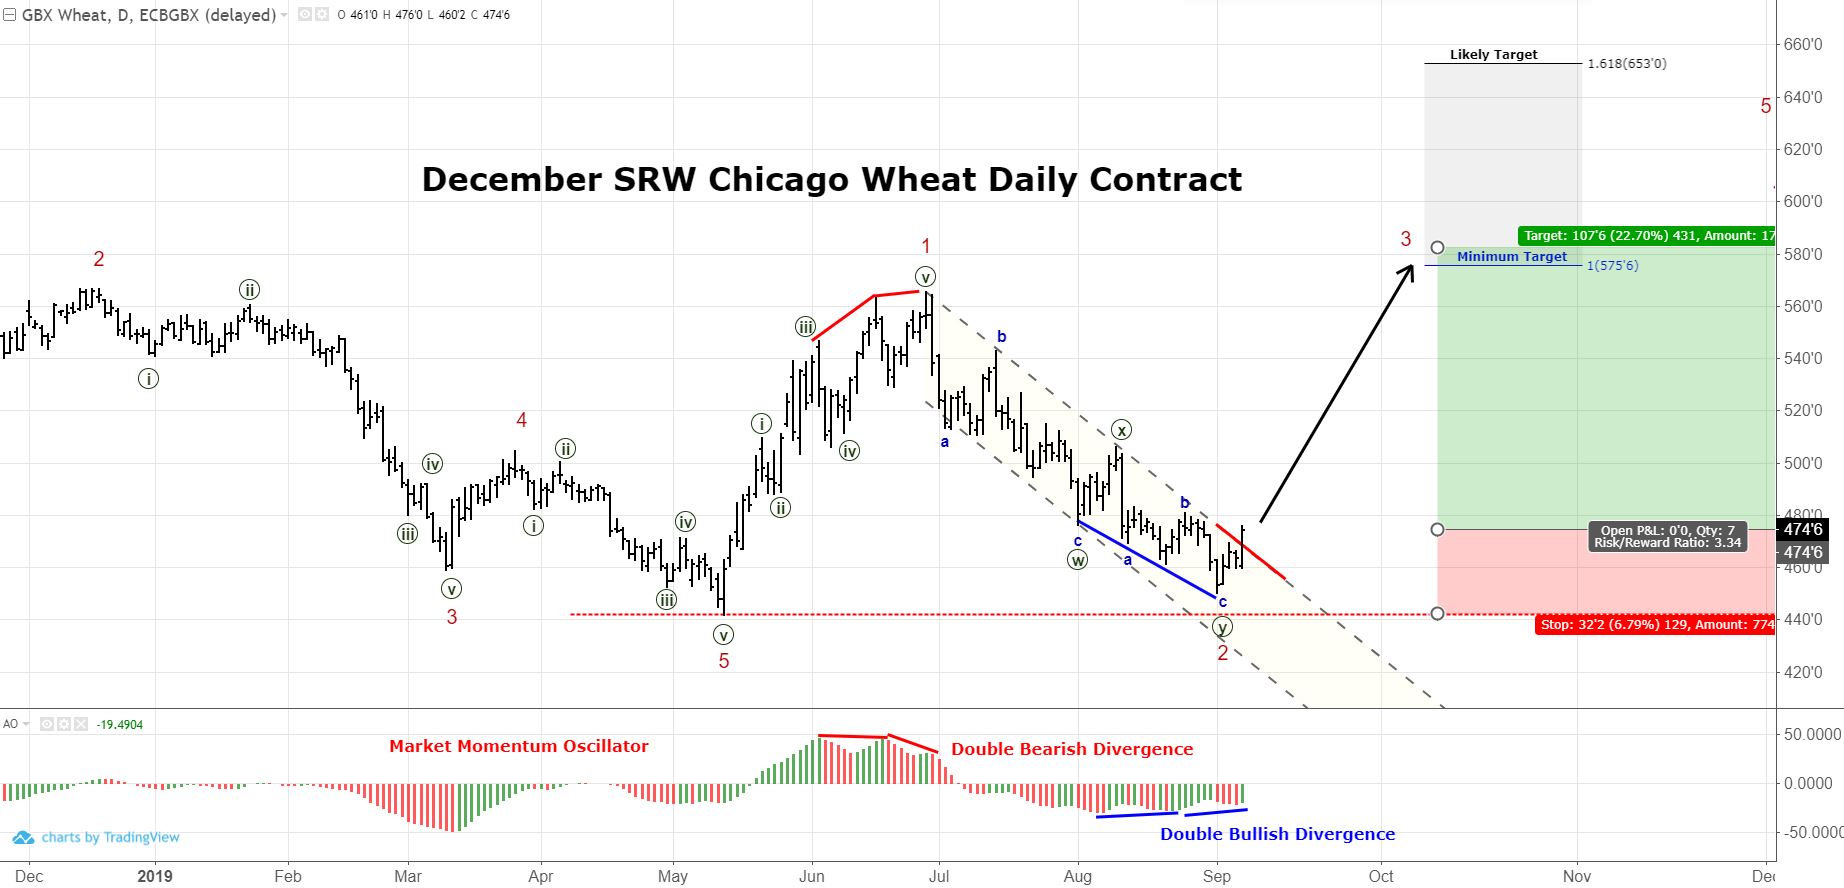
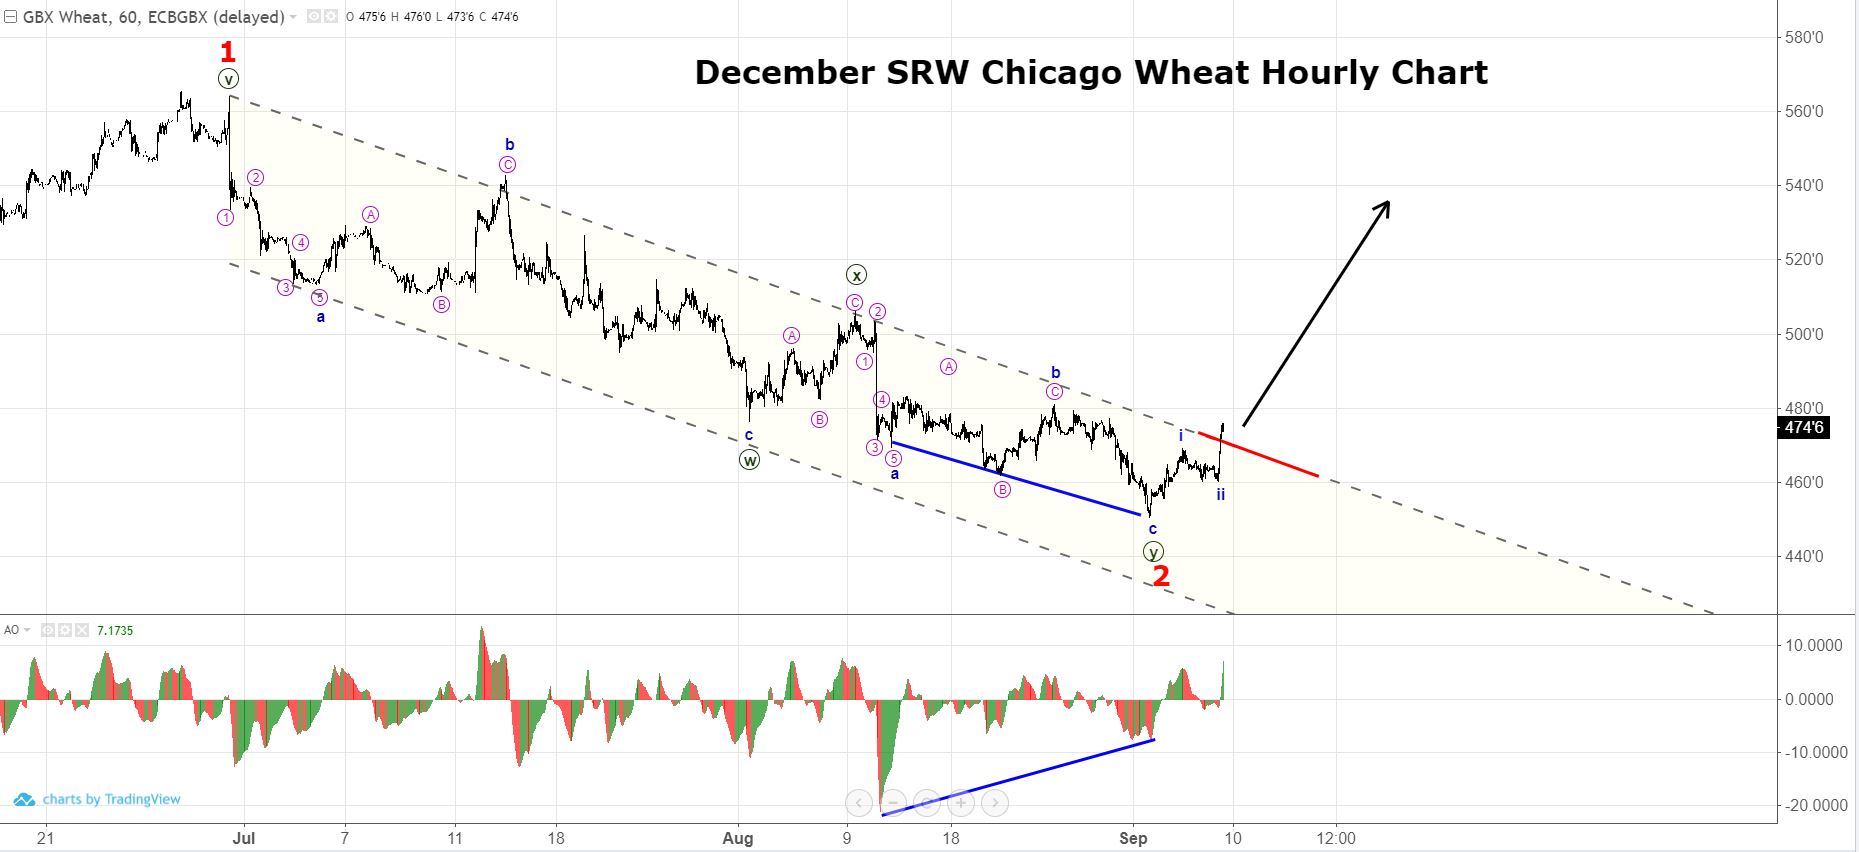
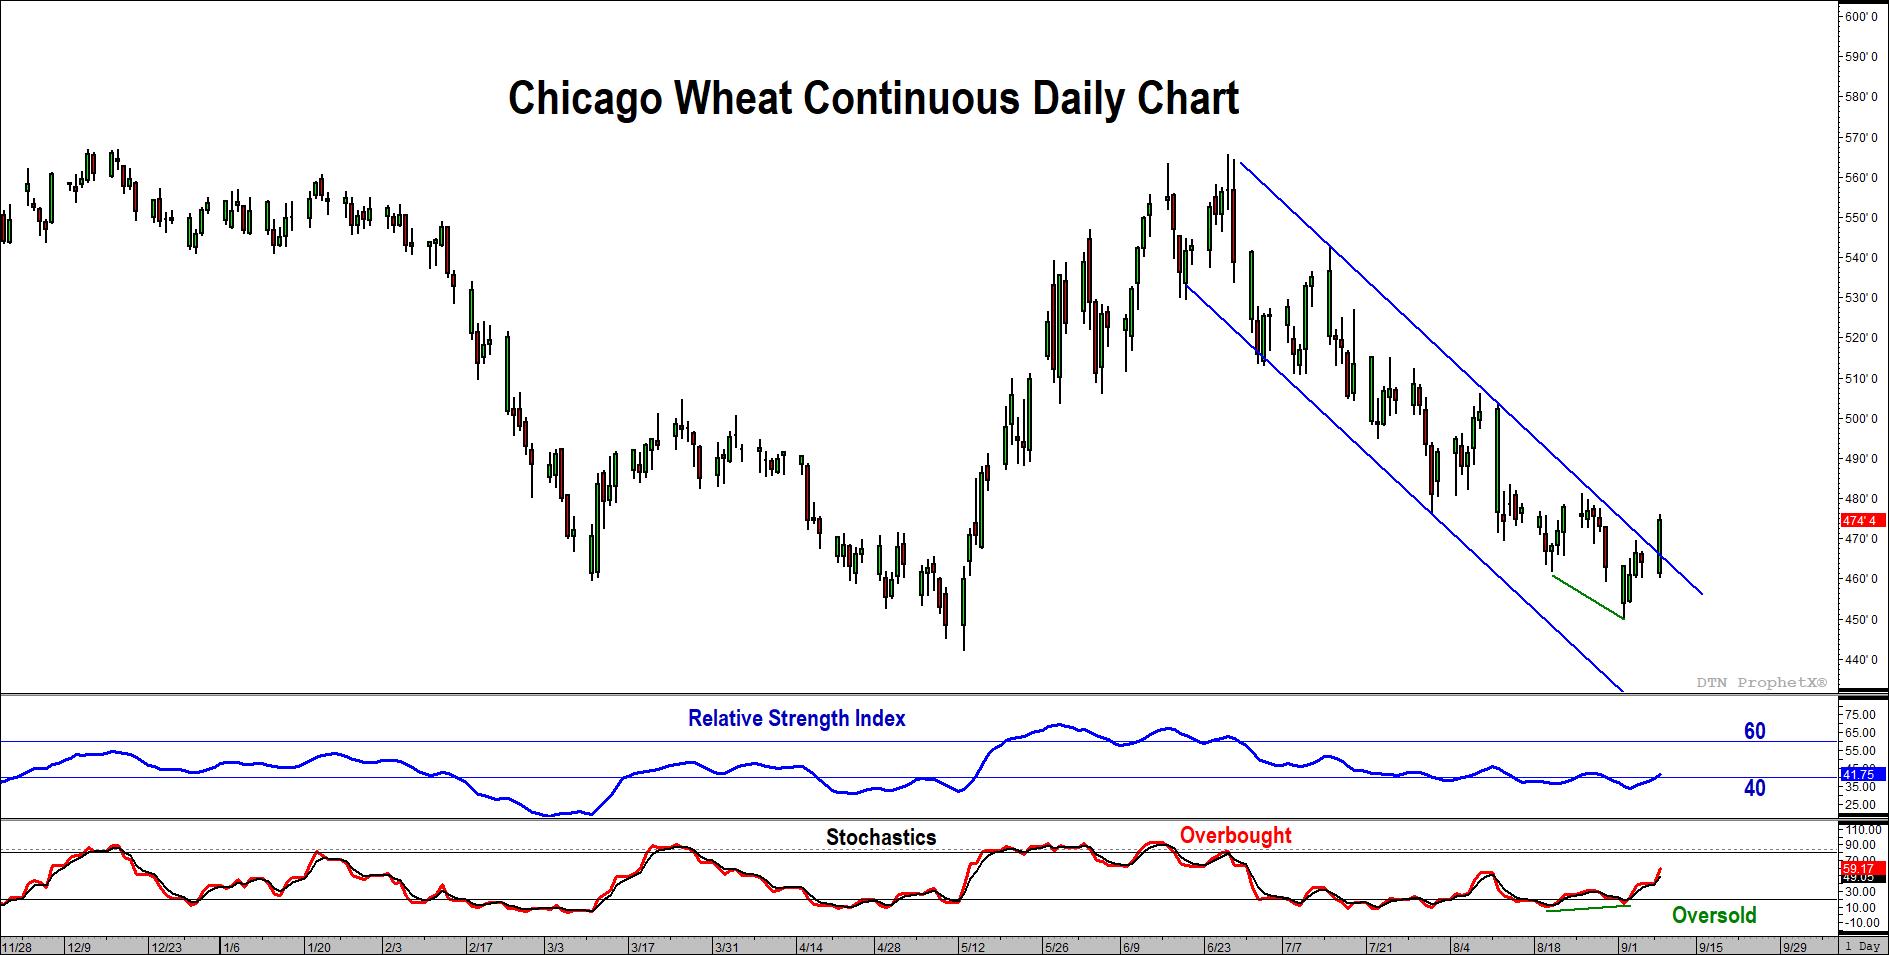
Wheat looks to have broken out of its corrective price channel and given its current price levels, this is a sign that “it is a good time to buy”. Looking at the December Daily & Hourly charts, we can see the following pieces of evidence to add confidence to our wave count.
- (Daily) In the past 4-6 weeks, there was double bullish divergence (lower lows in price higher lows in momentum). This almost always results in a nice reversal to the upside.
- (Daily) Prices have broken the corrective price channel. Most corrections occur within parallel lines; thus, price movement outside the parallel channel suggests it is not a correction or the correction is over. It is safer to wait for 2 settlements outside the channel when using this method.
- (Hourly) Severe divergence in price and momentum
- (Hourly) Nice countable substructure with the waves
Further Evidence Can Be Found By Looking At The RSI and Stochastic Indicators
- Back in May and early-June, RSI ascended above the bear market resistance level of 60 and stabilized. In the subsequent pullback, RSI has held at or above the bull market support level of 40 (with a slight exception of the absolute low of the move. This gives confidence that the overall trend is to the upside.
- RSI went into oversold territory on the down move and then showed divergence on the absolute low within the oversold territory. This adds confidence that the reversal to the upside is now taking place.
Targets & Risk-Reward
Given that the initial wave up (wave 1) was $1.23 in length, we can expect the corresponding wave 3 to have a minimum target of $5.75 (were wave 3 =wave 1). However, given guideline #3 of Diagonals, we can expect that wave 3 will be extended. Guideline #3 states “Within an impulse, if wave 1 is a diagonal, wave 3 is likely to be extended”. Our interpretation is that wave 1 is a leading diagonal based on substructure; thus, we can expect wave 3 to be extended. An extended third wave would put the likely target at $6.53.
(Daily Futures Chart) If we took the modest projection of $5.75, we can see a long position here would have a risk-reward of 1:3.34 when measured against a new low (the critical level for this interpretation). If we look at the risk-reward of the likely target of $6.53, we see the scales move to 1 unit of risk per 5.5 units of potential reward.
Procurement & Pulling the Trigger
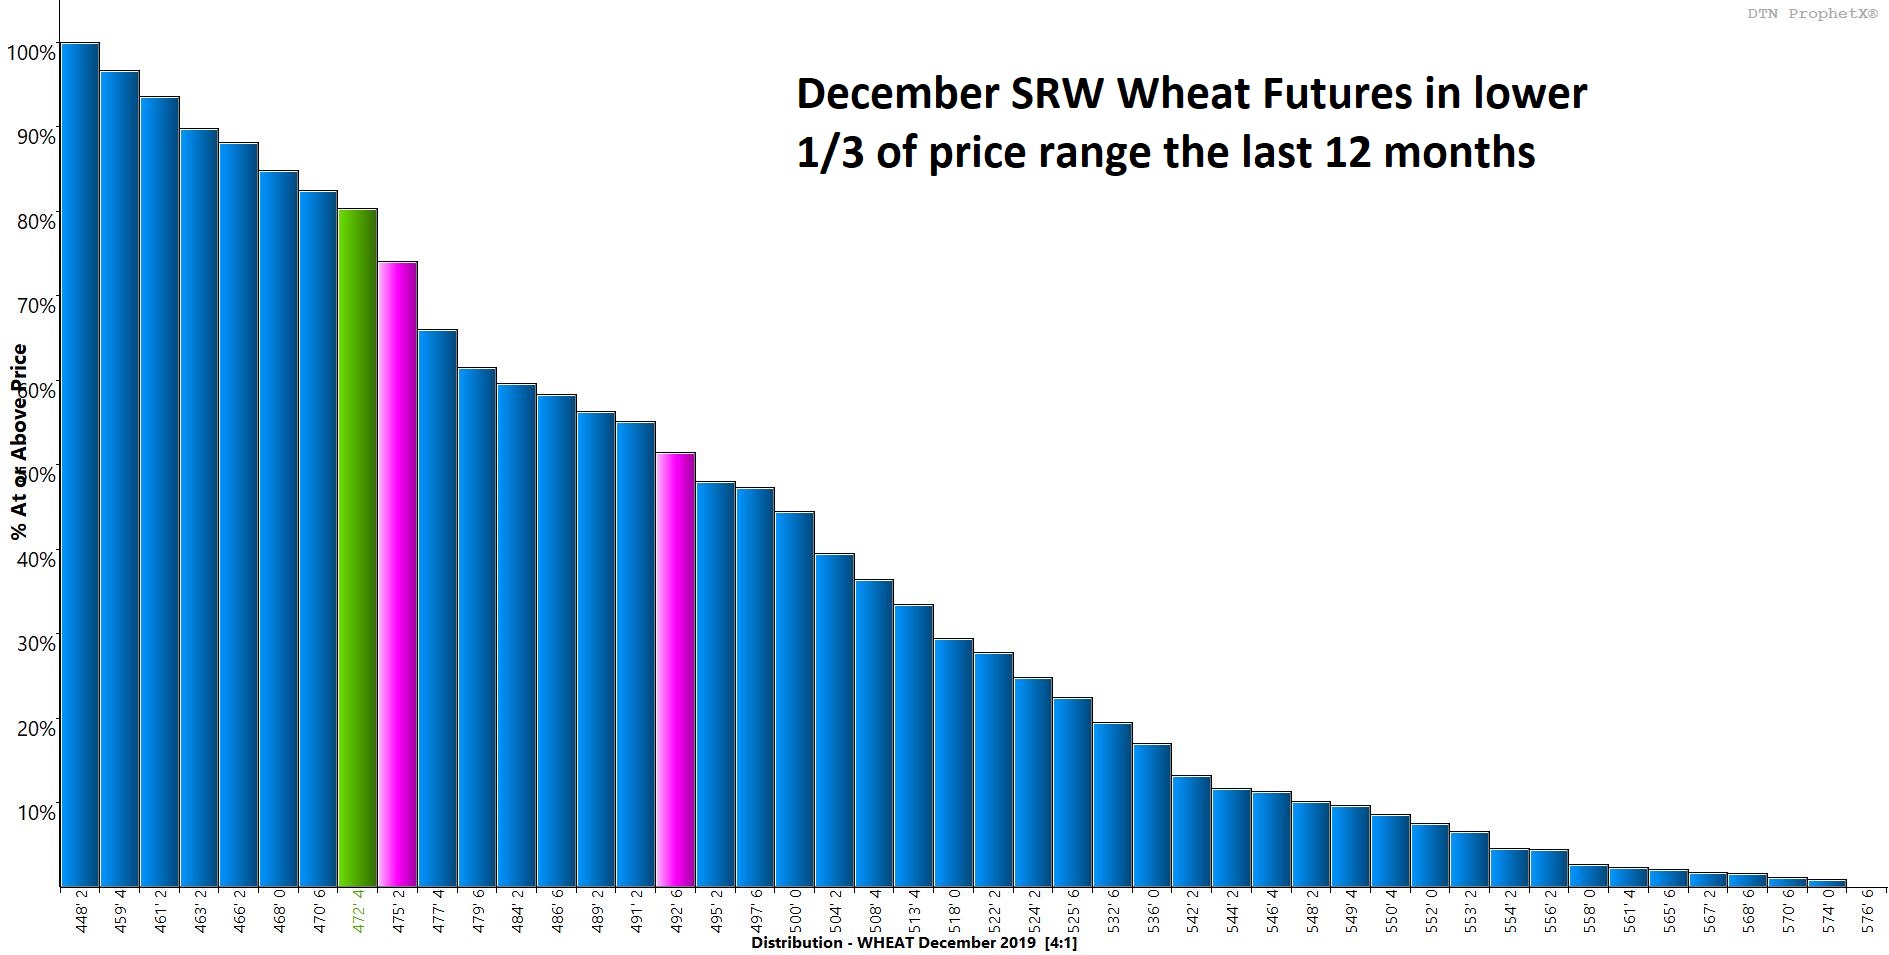
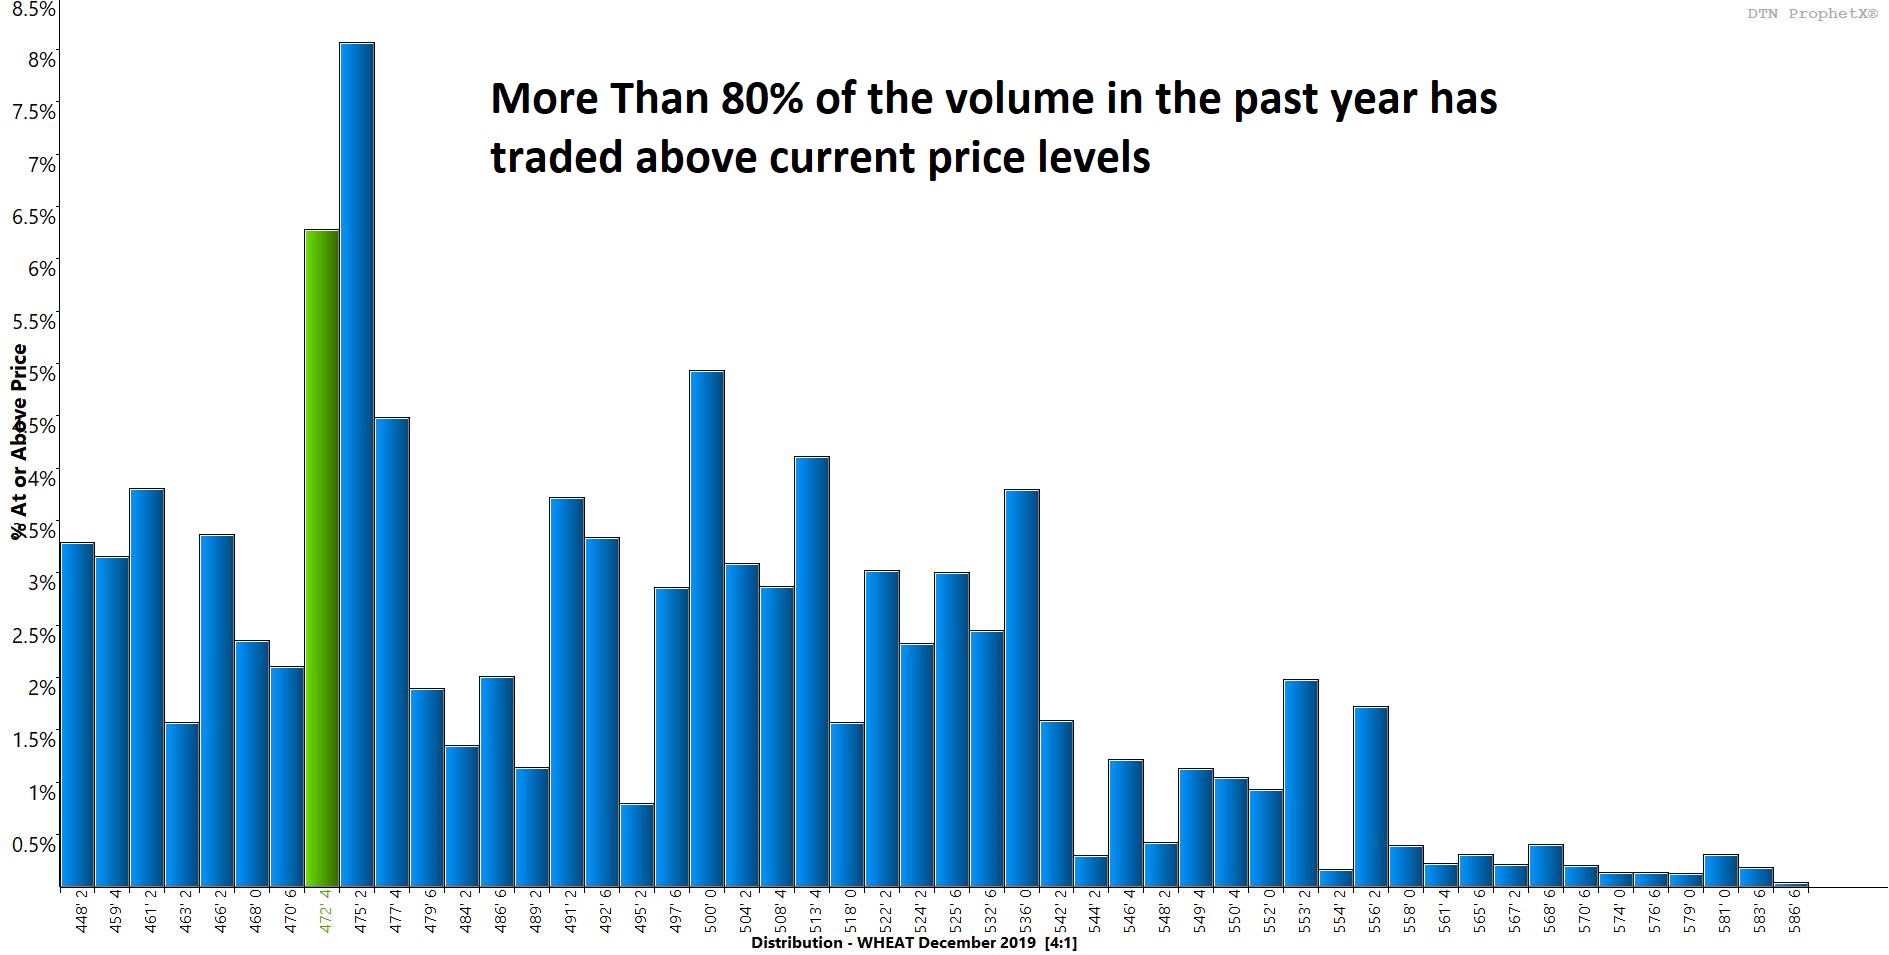
To help buyers “pull the trigger” on procurement give the presented evidence, I have added a price distribution and volume distribution of December Chicago Wheat. You can see that even after the 2.37% rally of 11¢ on Monday, current price levels are in the lower 1/3 of prices traded in the last year. Purchasing your needs in the lower 1/3 should be a goal of every buyer along with meeting your budget. Looking at the volume distribution, we can see that more than 80% of the volume traded in the last year has exchange hands at prices higher than current levels. One way to look at this is “if I buy my wheat here, at least I am doing better than 4 out of 5 other buyers this year”. That’s something that will help you keep your current job.
