Looking at the range of prices in recent years, the potential change in trend, and the subsequent target price for OJ futures, the market is offering a juicy risk-reward opportunity to establish long positions and procure your Orange Juice needs through 2019. Evidence below.
There’s a juicy opportunity in OJ Futures as a potential change in trend looms
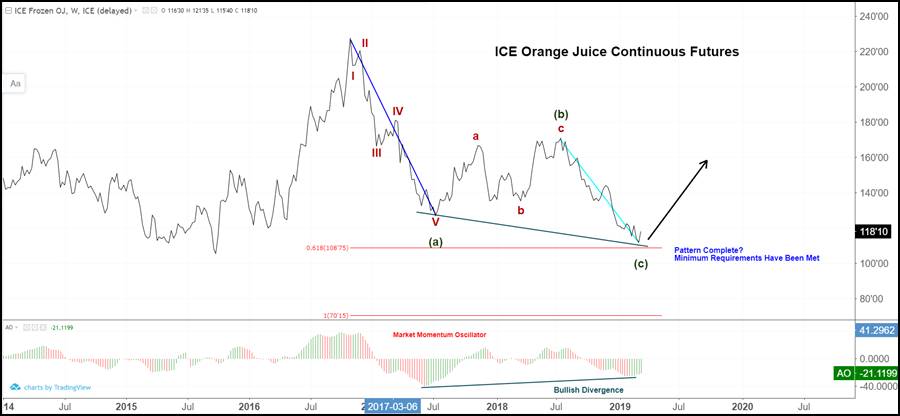
Long-term Weekly Chart
- All the requirements are met for a completed pattern
- Slope analysis: Wave (c) slope less severe than Wave (a) slope…typical at end of correction
- Fibonacci: Wave (c) is just about .618 of Wave (a). Second most common relationship (#1 is equality)
- Bullish Divergence with momentum and price….often results in change in trend to the upside
Bullish divergence with momentum and price suggests prices may move to the upside.
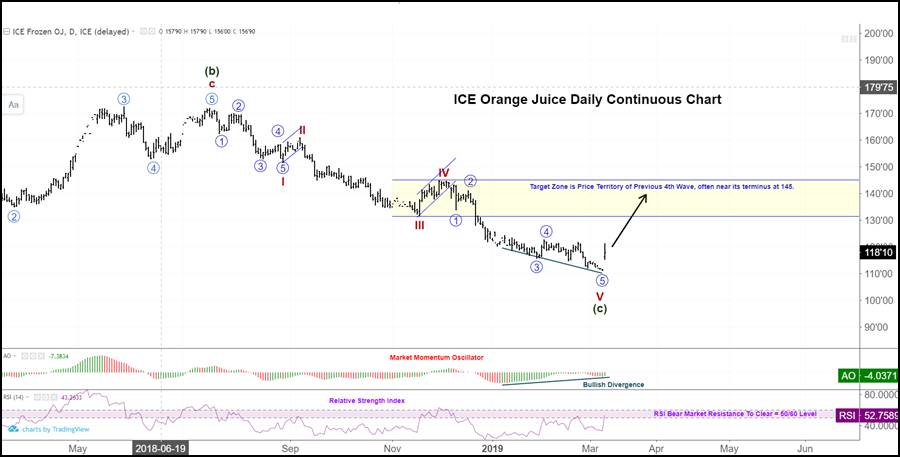
Daily Continuous Chart
- Minimum requirements are met for a completed pattern…..cant be surprised if trend changes
- Bullish Divergence with momentum and price….often results in change in trend to the upside
- Confidence will build if/when RSI stabilizes above 60.
- Should be noted the gap in price is due to a contract rollover
- Target price if wave V of (c) is complete would be 140-145 (guideline of previous 4th wave).