Although Live Cattle futures have had a rough go since President’s Day, the tide may be turning. Since the Exchange holiday on February 19th, April futures have fallen $6, or 4.7%. Market shorts are excited and feeling great; longs have been biting their nails and finding it difficult to hold steady. Taking a look some technical indicators, we can gather a perspective that reduces the roller-coaster emotions of commodity trading and helps us make more informed decisions.
Looking at a daily and hourly charts of April futures and technical indicators (below), we can find evidence that current the downtrend my be complete and the market may set its eyes on higher prices.
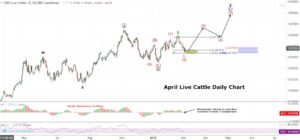
- The most recent move lower (wave(2)) has retraced 50-62% of the wave (1). These are the most common Fibonacci retracements for a wave 2.
- Wave C of (2) is near 1.38*Wave A of (2). This is a common Fibonacci relationship in expanded flat corrections
- The momentum on the daily chart has returned to the zero-line. When Momentum returns to the zero-line, it is often when a correction of the overall trend is complete.
- The RSI has held above 40 on the move lower. The level of 40 in RSI should be considered support for an uptrend when experiencing counter-trend moves lower. If 40 holds, it usually means the overall trend is still higher.
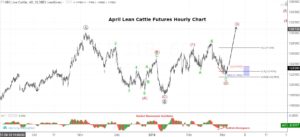
- The momentum on the hourly chart shows bullish divergence as we have had new lows in price, but not accompanied by new lows in momentum. Sign of a potential turning point.
I would not recommend trading any market off 1 indicator. However, when we have multiple indicators telling a similar story, we can feel that probability is in our favor. Here, we have: a Fibonacci cluster of 2 different wave patterns; Momentum on the daily chart suggesting the correction lower is complete; Momentum on the hourly chart showing divergence, suggesting a trend change is imminent; an RSI reading that suggests the overall trend is still higher. All of these in harmony with the suggested Elliott Wave interpretation. With multiple pieces of evidence, we can have more confidence (not hubris) in making a market call and taking risk.
Bottom Line:
- Market shorts should be very comfortable buying back their positions
- Market longs have reason to hang on, placing a stop-loss on a close below $121.50.
- Neutral positions should feel comfortable getting long. The risk-reward in a long position is in the the bull’s favor. Stop-loss of $121.50 vs. projected upside target of $130.00.
Chris J. Kristufek, CMT
![]()