Corn Futures To Turn Higher?
Although the future is uncertain, when balancing risk-reward analysis with the current most probable wave count in corn, now presents an excellent opportunity to buy (or extend coverage).
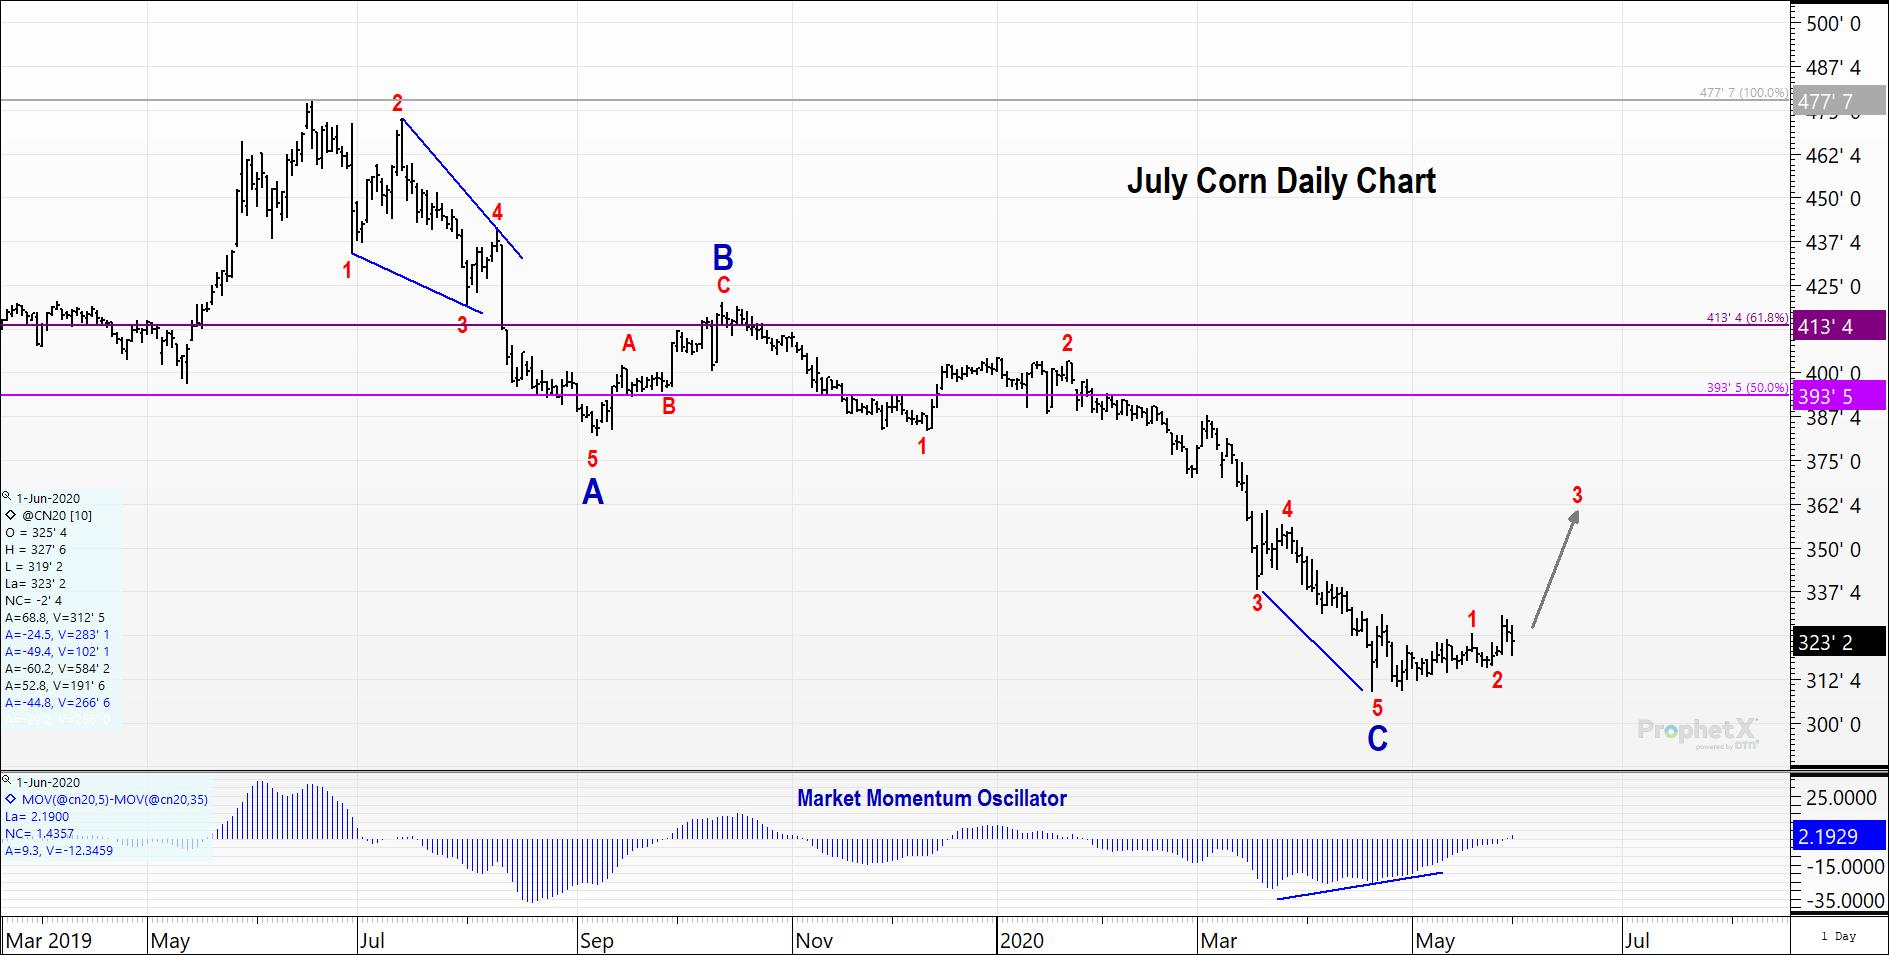
Looking at the wave count on the daily chart, we very well could be at the dawn of a wave 3 acceleration higher. We have a completed 3-wave move (A-B-C) that subdivides nicely into a 5-3-5, coupled with divergence in price and momentum.
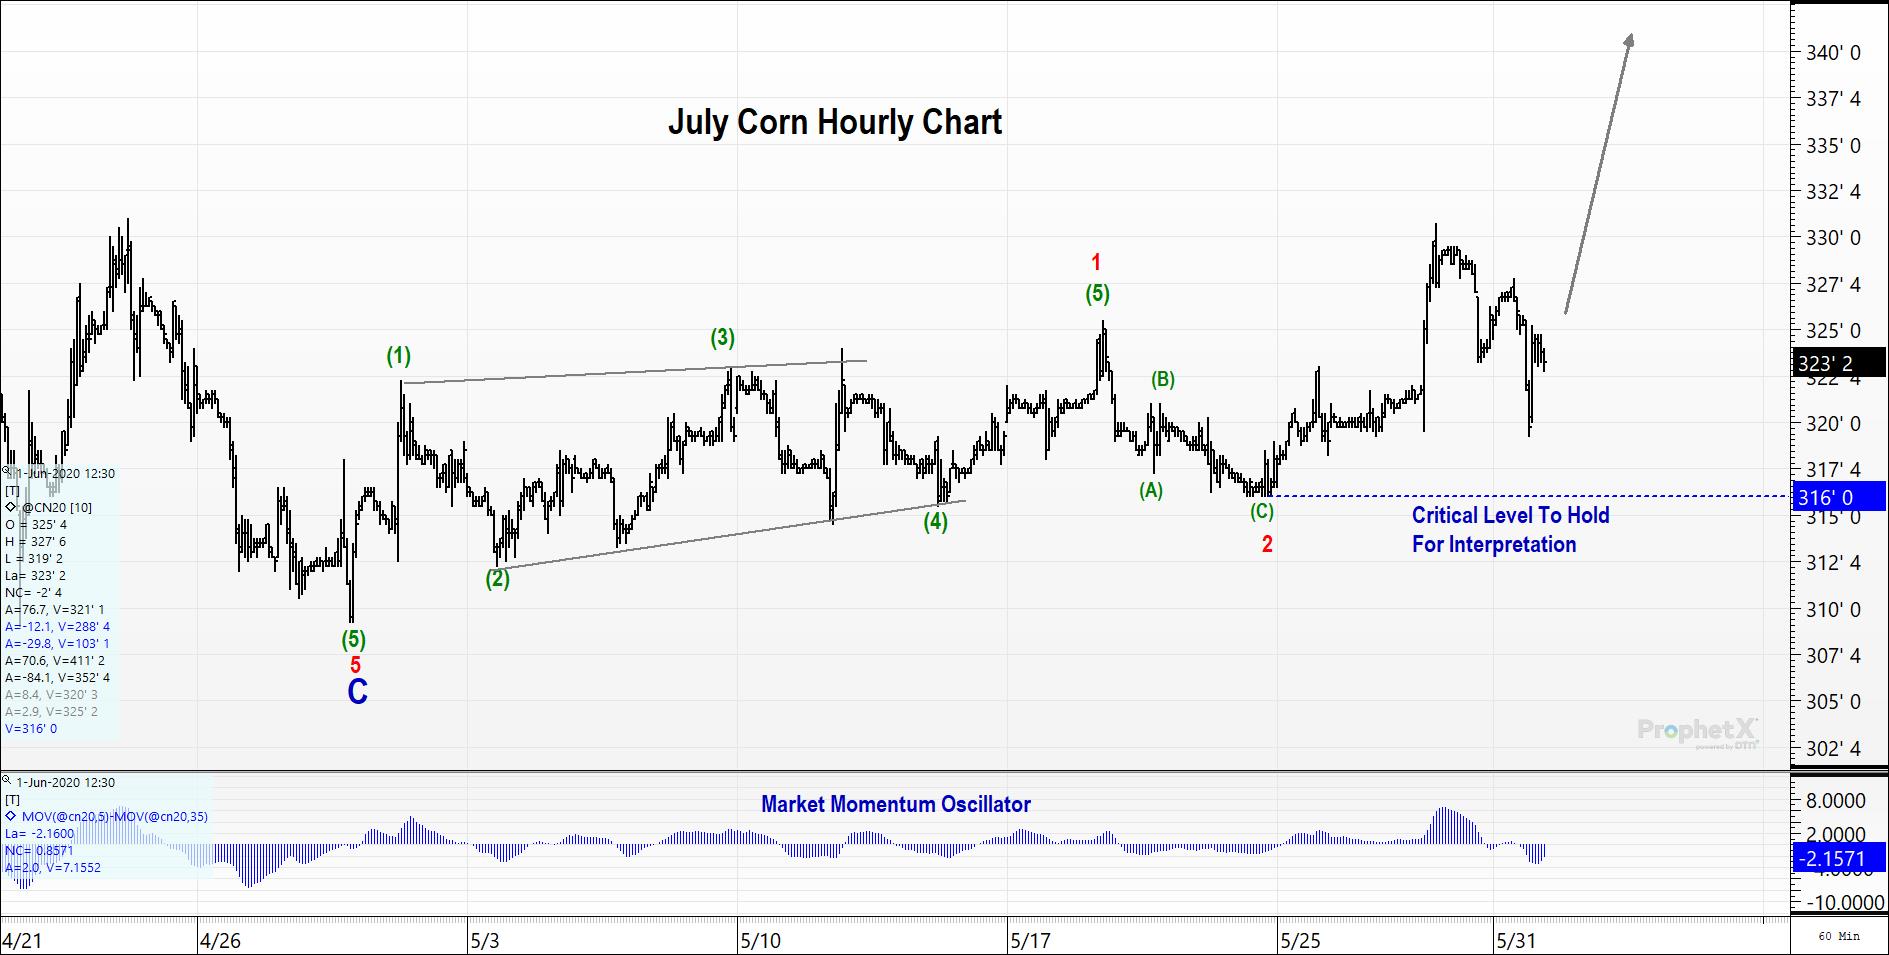
Zooming into the hourly chart, you can see the subdivisions. What is most noteworthy is the following 2 points: (1) wave 1 is a leading diagonal. Leading diagonals are often followed by exceptionally long extensions in wave 3 and (2) the most recent high was accompanied by the greatest momentum. This typically means you should get at least one more new high before the trend is over.
Critical support is clearly noted on the hourly chart. It is great that this level is so close to current prices as it makes for a good risk-reward decision process for longs.
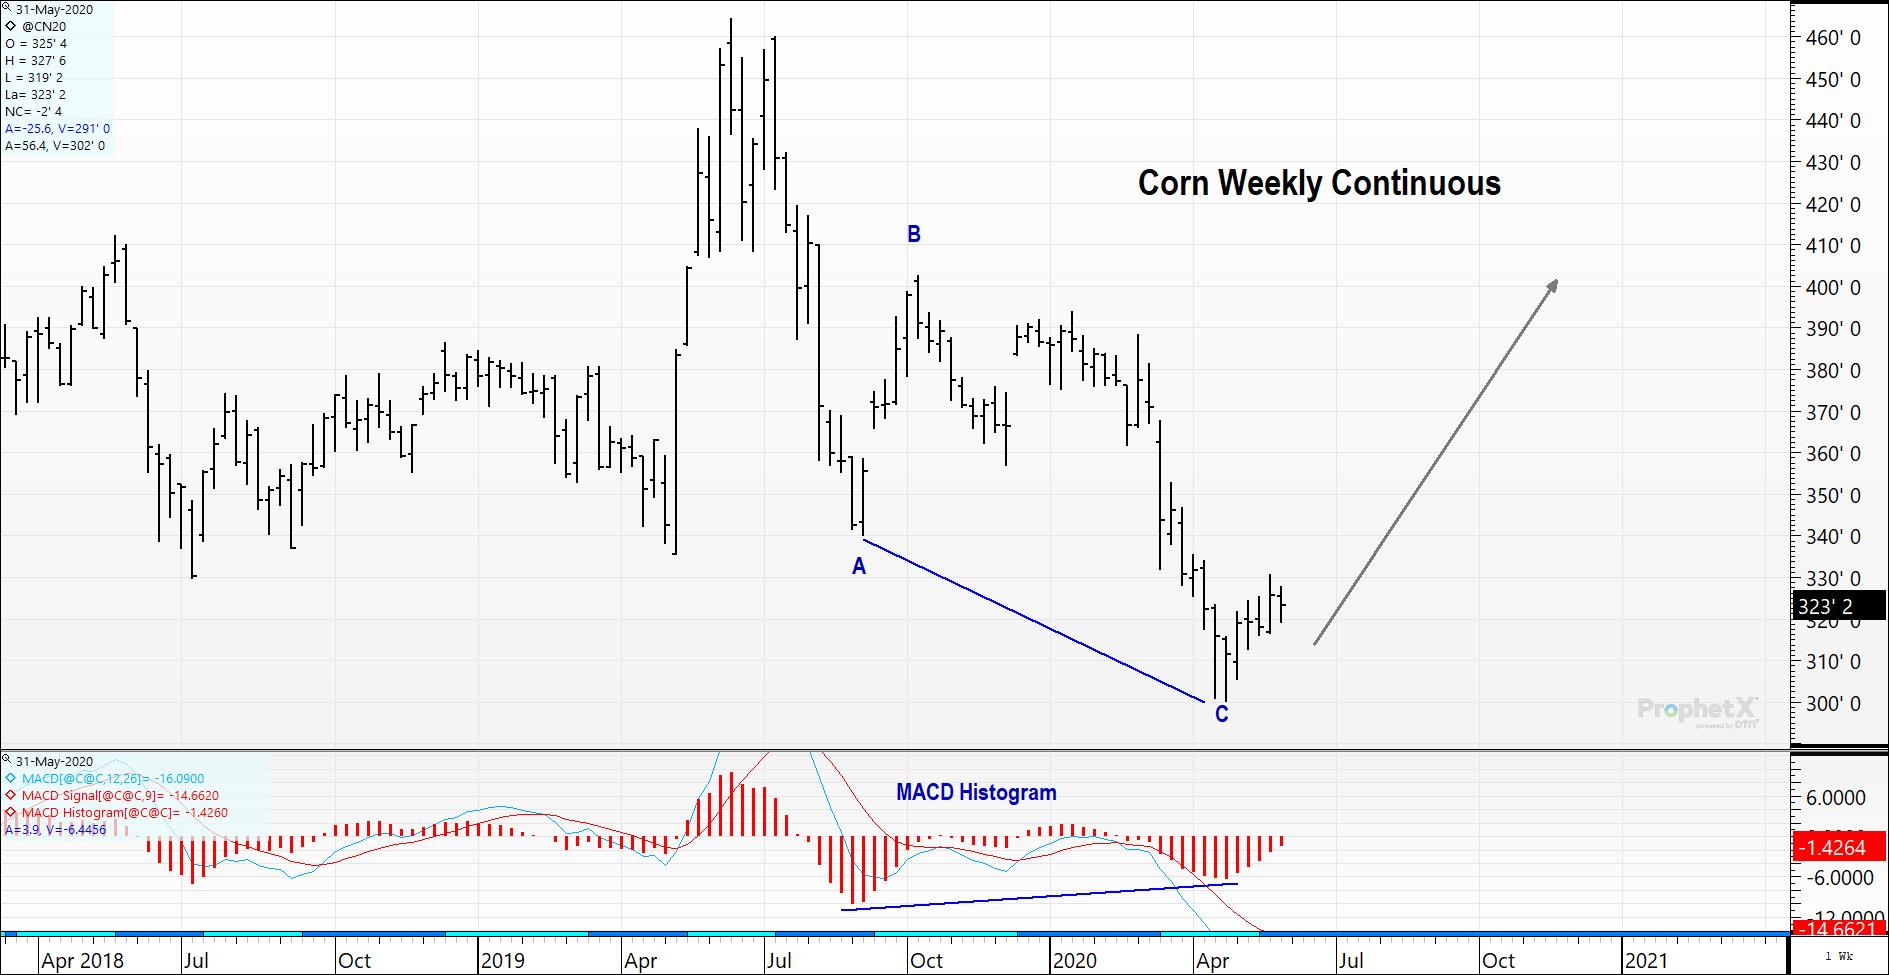
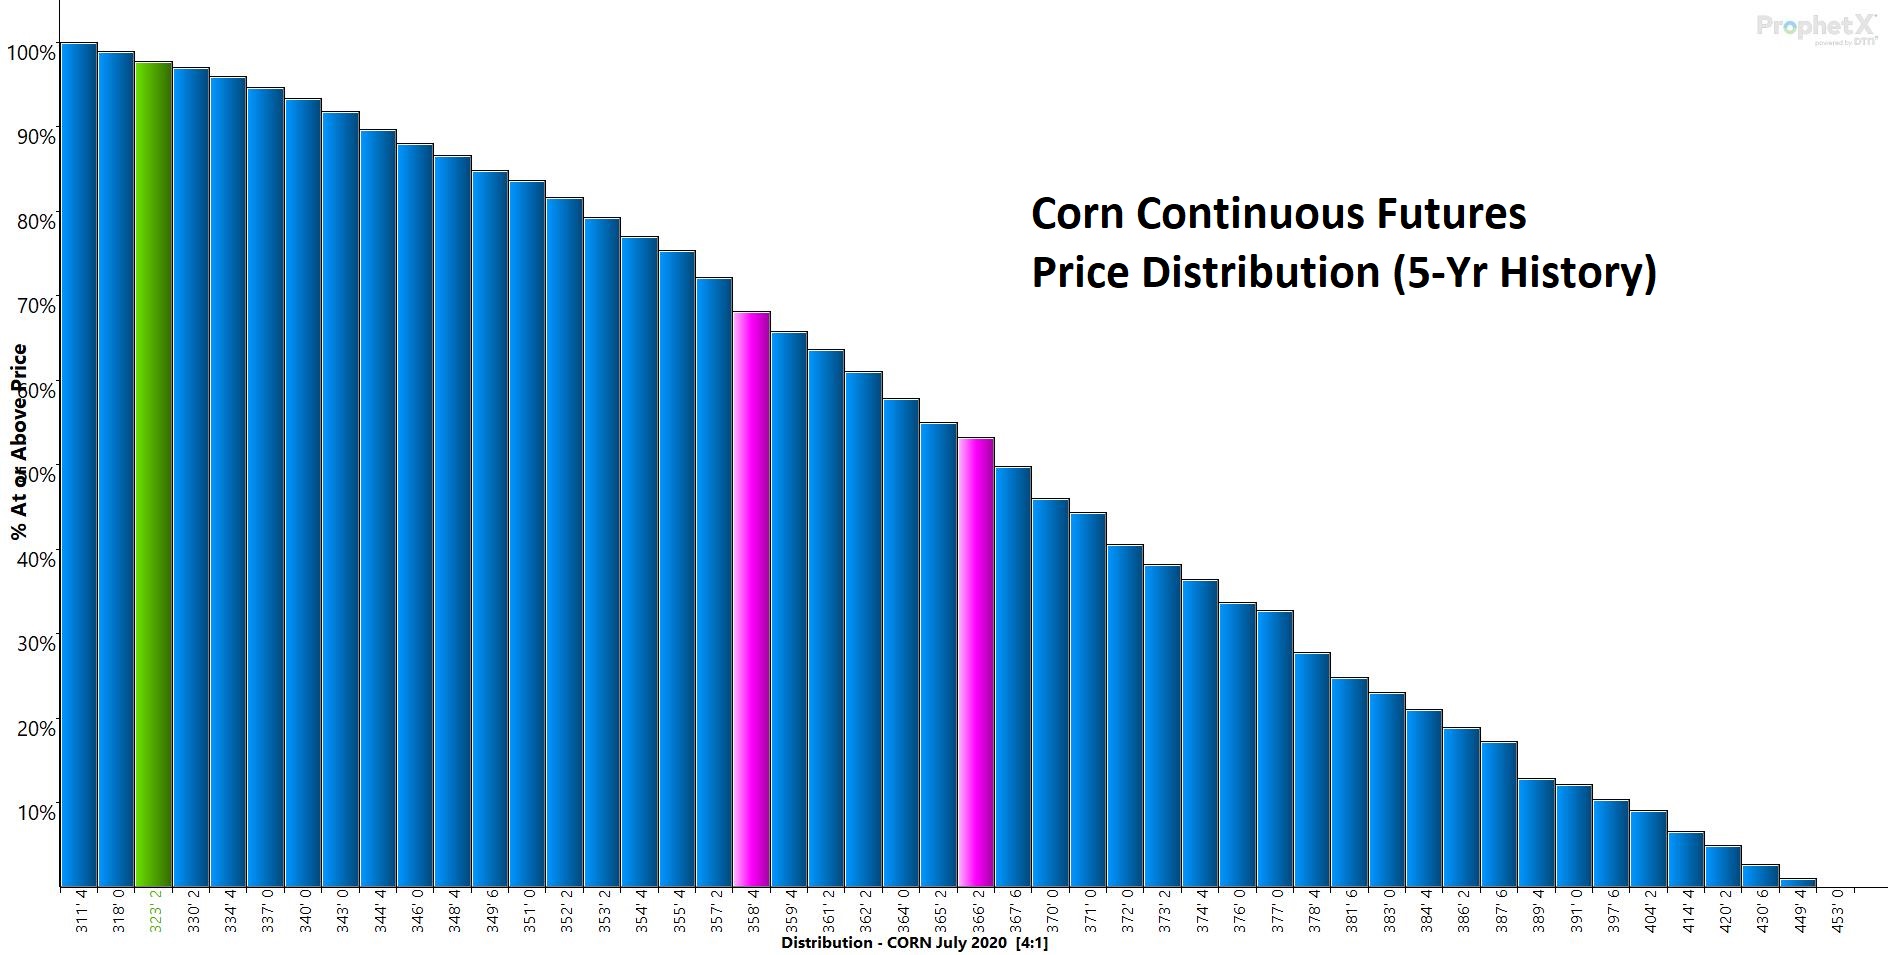
Getting a long-term view and perspective, you can see that the current offerings in corn are in the lowest 5 percentile of the past 5-year range. This should give any buyer or long confidence that they own value.
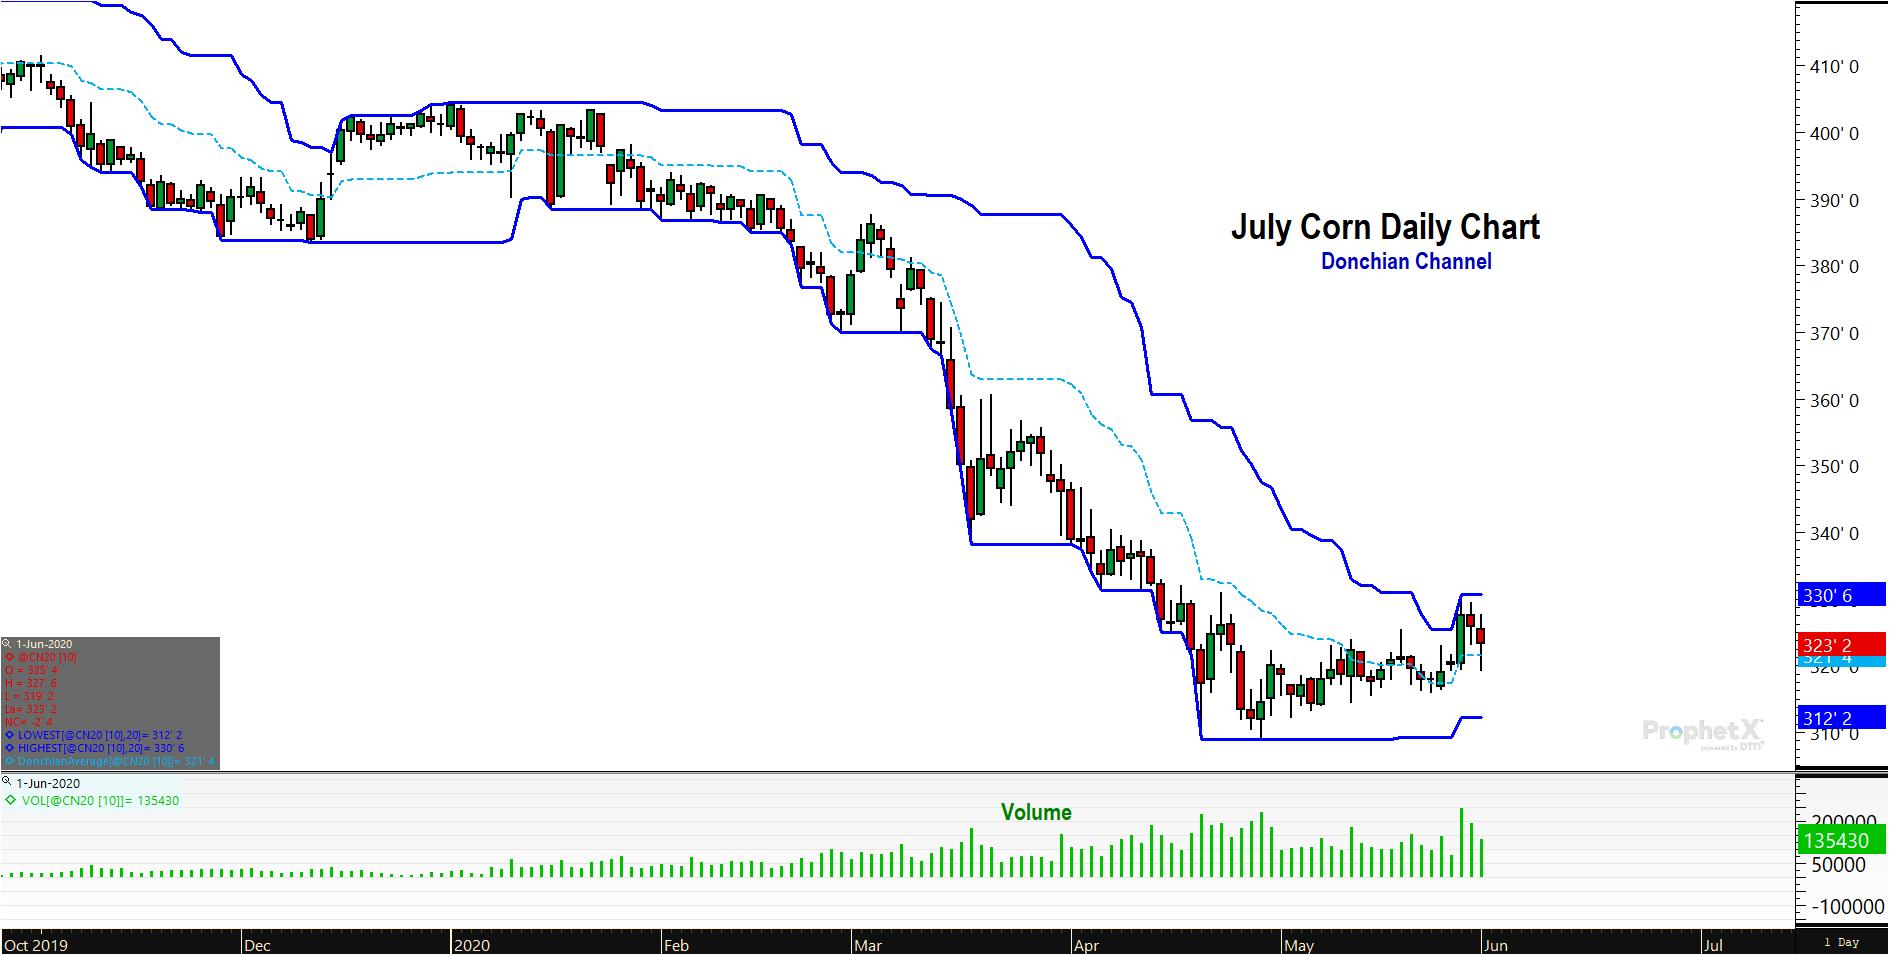
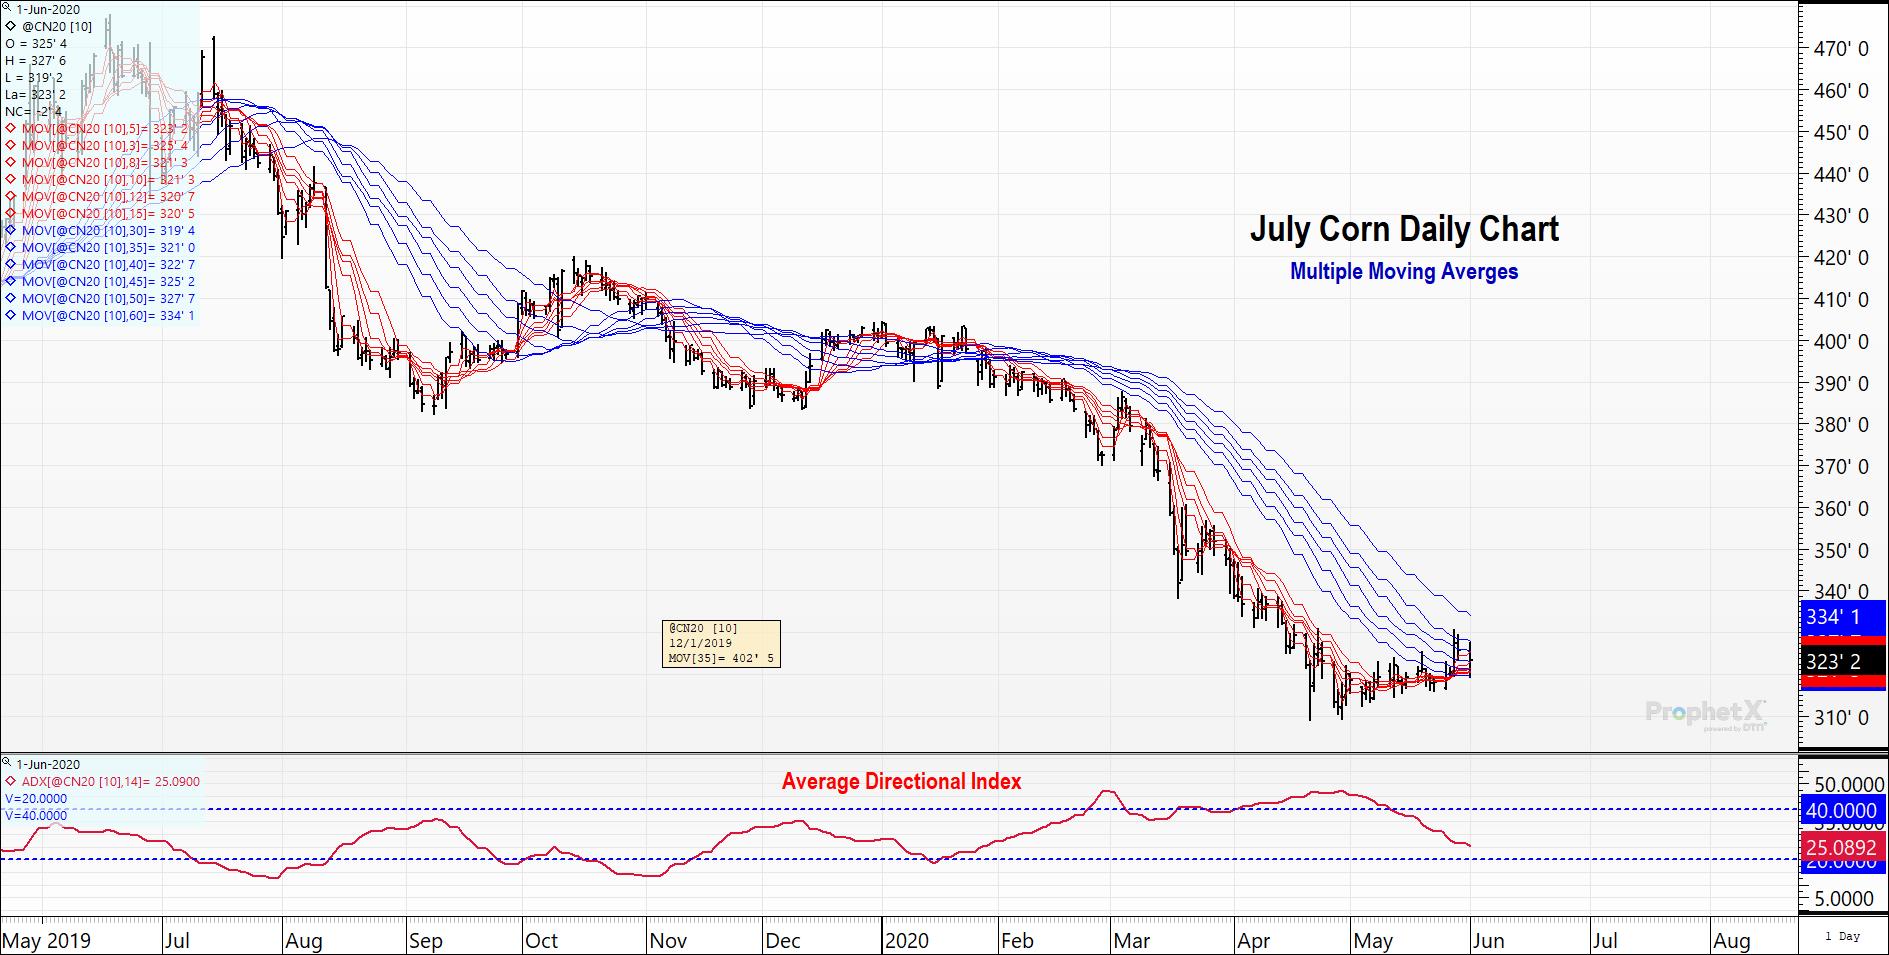
The slopes of short-term moving averages have turned higher and prices are currently above those moving averages giving this market a bullish tint. Long-term moving averages are flattening, a precursor to a potential trend change.
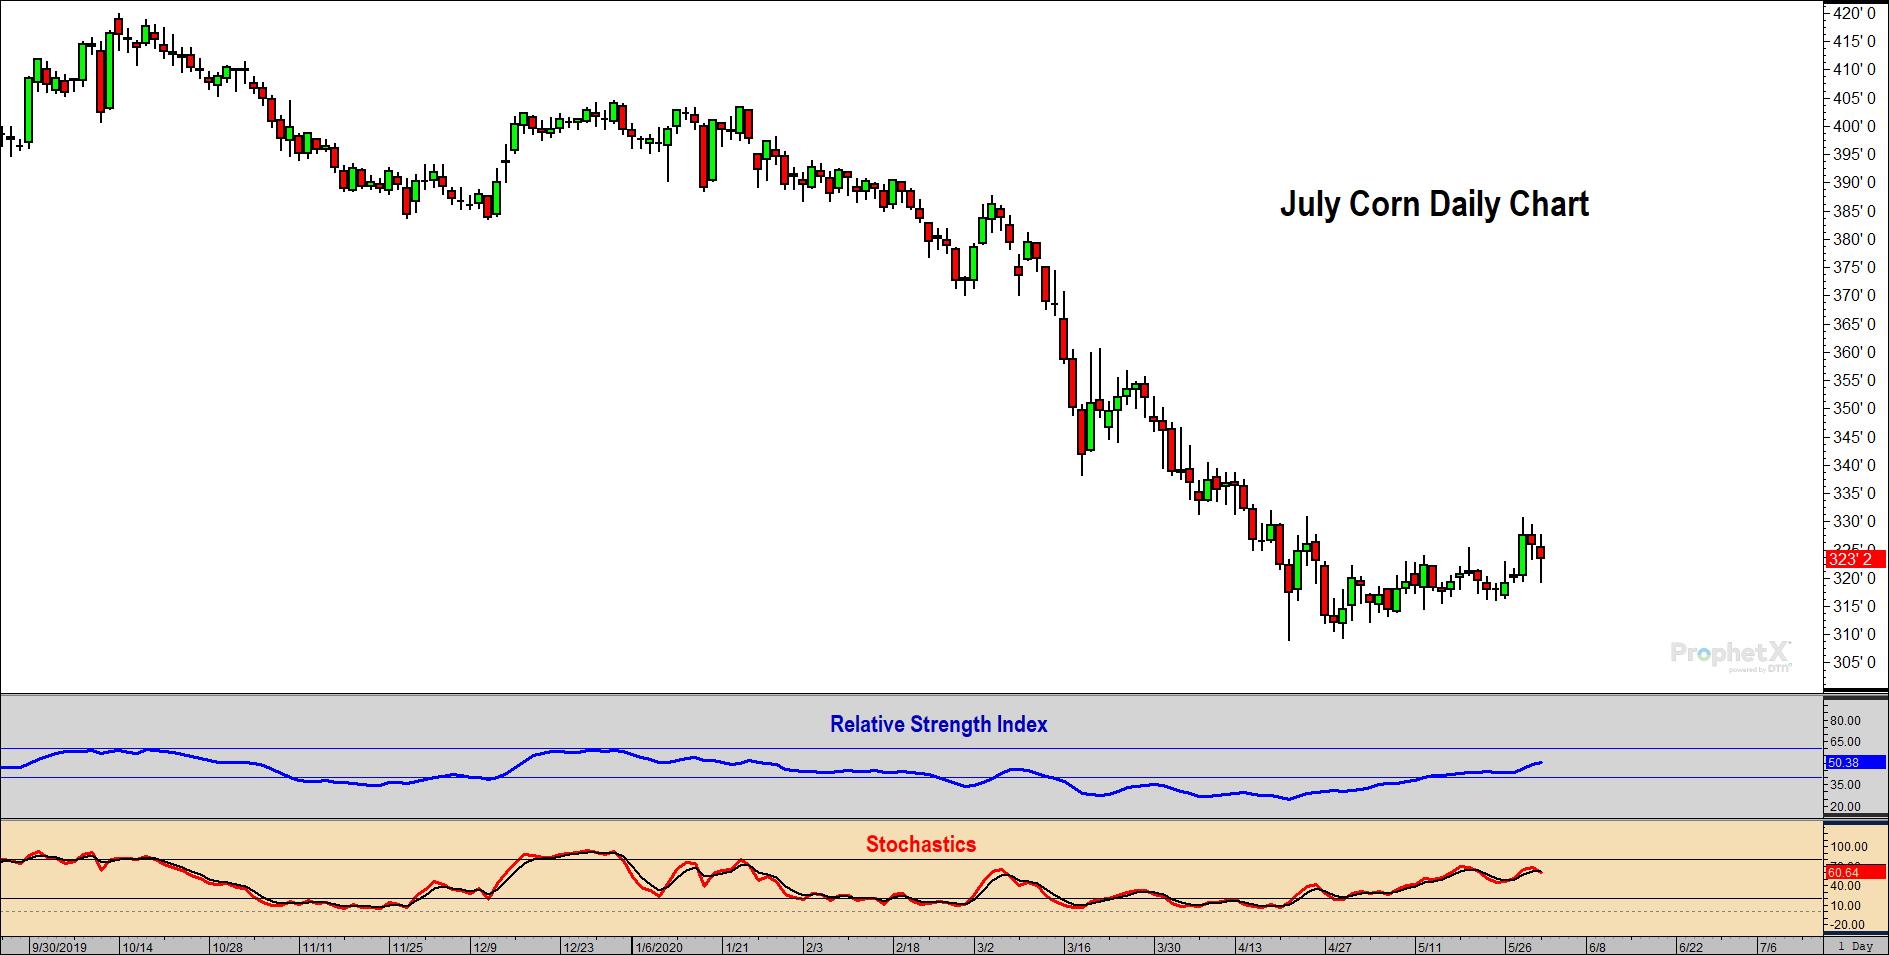
Both RSI and Stochastics are in neutral territory, but pointed upward. The big hurdle will be the 60 level in RSI. If the relative strength index can establish above 60 as prices rally that is often the signal that the previous downtrend is over. At that point, pullbacks can be bought with confidence.
Time will tell whether our wave interpretation is correct and prices regain $3.40/bushel on its way to $4.00. Regardless, given where prices are currently at and the upside potential vs downside risk ($3.00), it is a good idea to adopt this wave count in your analysis and extend coverage (get long).
