Soybean Oil:
We are seeing a reduction in global and domestic usage ratios on increased production as strong demand is outpacing higher production. A recent trend lower crush levels will lead to further reduction in US soyoil production and further tightening of soyoil stocks.
- The June NOPA crush dropped by more than expected to the lowest level in 21 months. It was the fourth consecutive m/m and y/y decline.
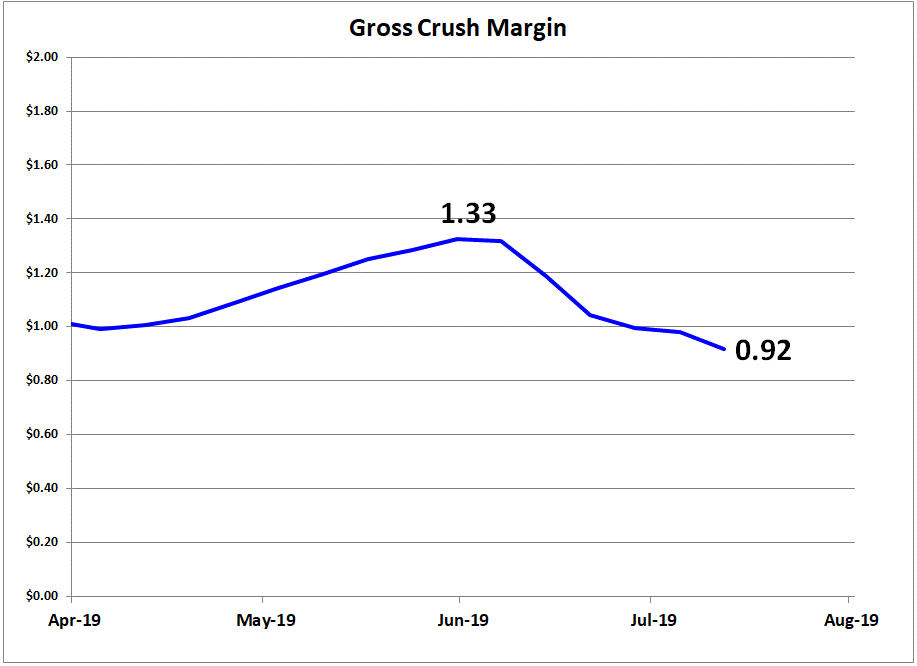
- The series of falling crush levels coincide with sharp y/y cuts in soymeal exports. NOPA June meal exports were down 39% y/y, following a 32% y/y decline in May and a 19% drop in April. e., diminishing demand for meal, with an attendant drop in the gross crush margin from $1.33 at the end of May to $0.92 at the end of last week (see chart below) have contributed to the lower crush levels.
- NOPA June SBO stocks were at a six-month low, down 17% y/y.
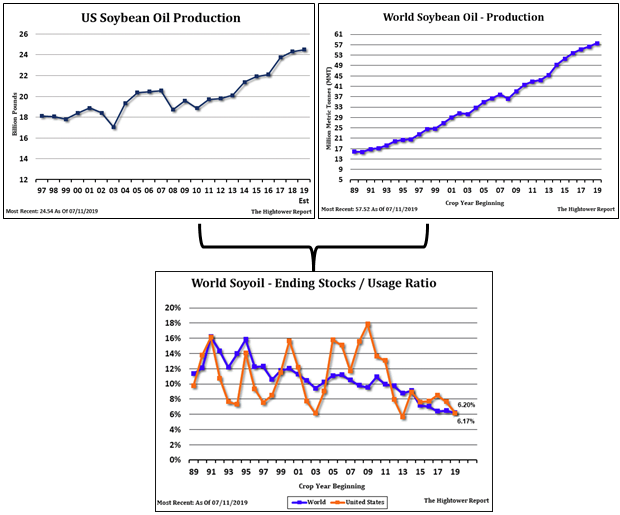
- More concerning, is that the domestic usage ratio is at a seven-year low and the global usage ratio is at low going back to 1989—as both world and domestic production steadily increased over those years. (See World SBO Production, US SBO Production and Usage Ratio charts below.)
- The recent easing of board crush margin and declining/smaller than expected crush levels undermine the notion that US crush will remain large enough to preclude soy oil tightness in an environment of strong SBO demand.
Palm Oil:
Similar to SBO, a declining global usage ratio reflects demand is outpacing higher production.
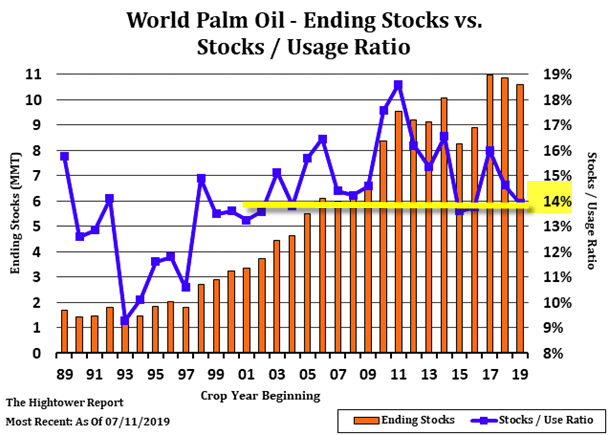
- The World Palm Ending Stocks chart below highlights—with the yellow line—a series of usage ratios around the 14% level. Beginning with the 2002 data point one can see that a progressively higher level of ending stocks has been necessary to sustain the 14% usage ratio in an environment of increasing demand.
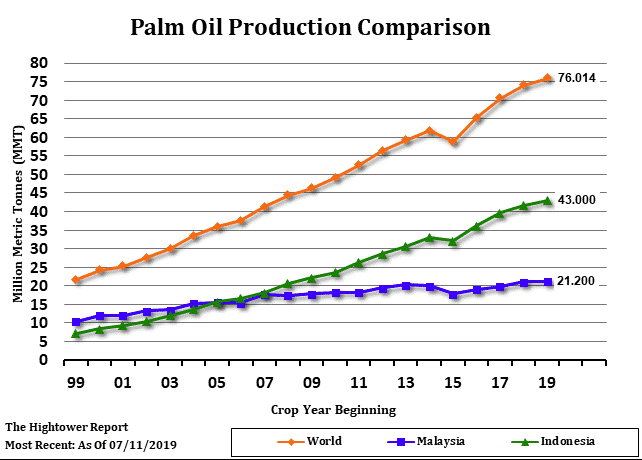
- The second chart below shows global palm oil production steadily increasing over these years.
- Focusing on the last three years in both charts one can see that rising demand is outpacing rising production as both ending stocks levels and the usage ratios have dropped.
World Vegetable Oil:
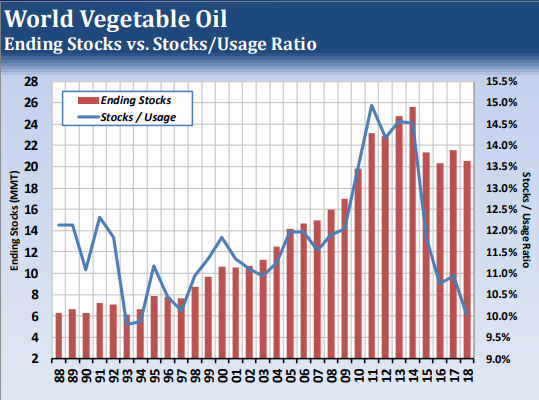
On the broader scale of all world edible oils, the chart below reinforces the notion of a developing bullish scenario as the usage ratio is poised to drop below 10% for the first time since 1994.
